

2026 Financial Performance Benchmarks Report for Manufacturing Companies
Compare your profitability, productivity, working capital and workforce performance against more than 500 U.S. manufacturers to identify where you’re outperforming—and where there’s room to improve.
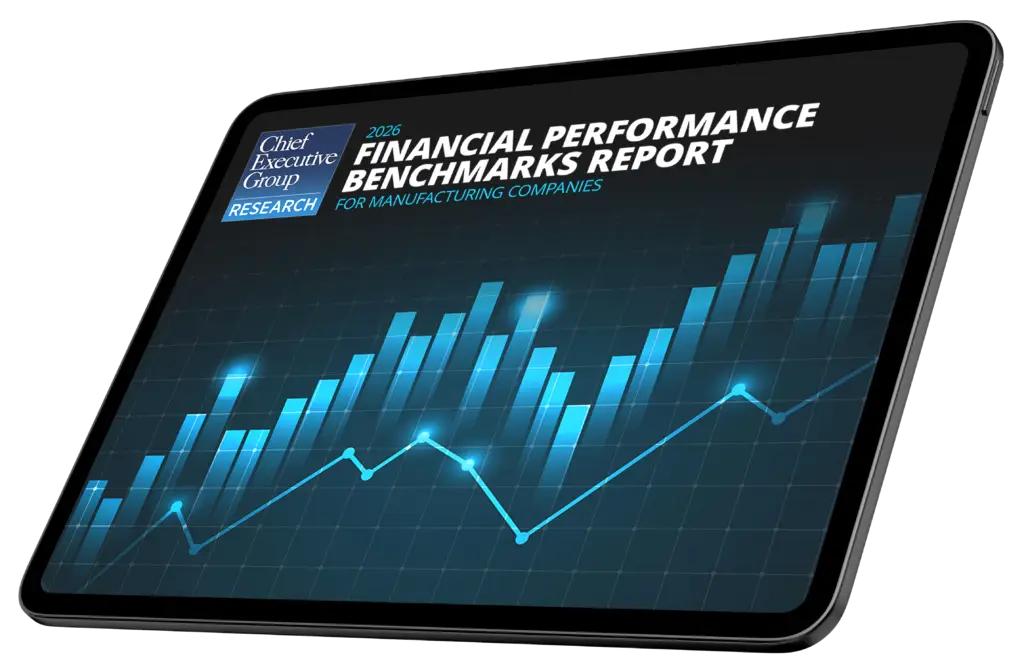
Compare your margins, productivity, cost structure and working capital against similar manufacturers to identify where you're outperforming—and where there's room to improve.
See how your inventory, capacity utilization, quality and delivery performance compare with other manufacturers—and identify opportunities to improve efficiency.
Compare workforce productivity, staffing levels and labor utilization against manufacturing peers to understand whether your workforce is supporting stronger financial performance.
Validate decisions on pricing, hiring, investment and operations with objective benchmarks from more than 500 manufacturing companies.
The report helps leadership teams make more informed decisions about growth, investment, hiring and operations by putting their performance into context.
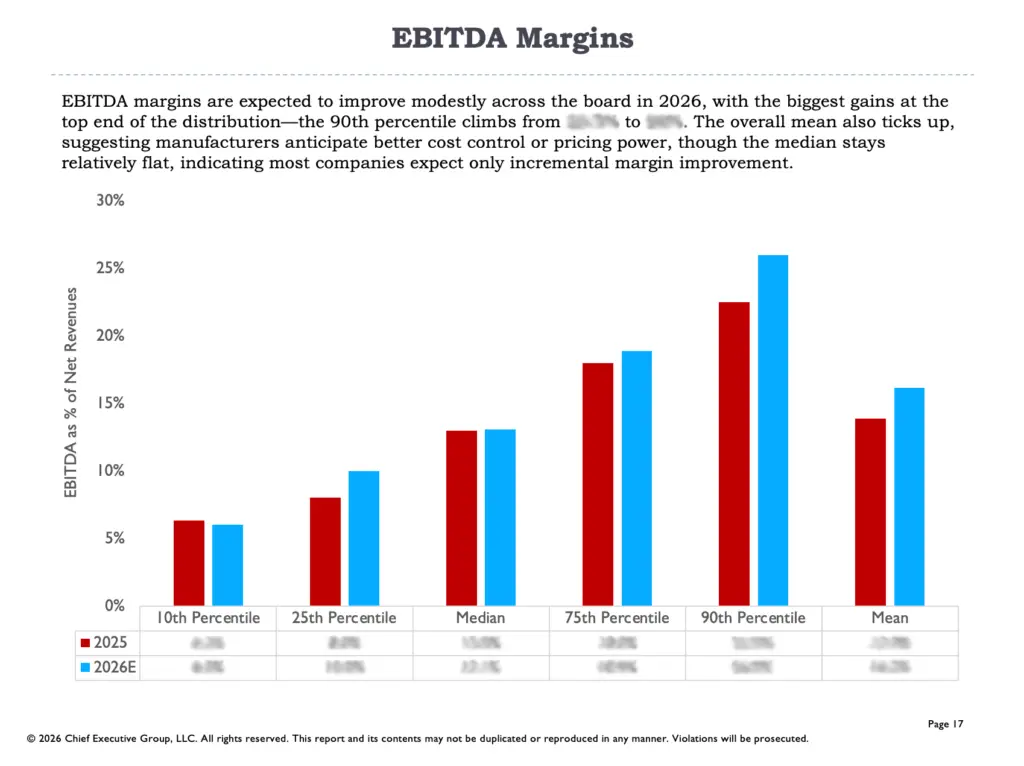
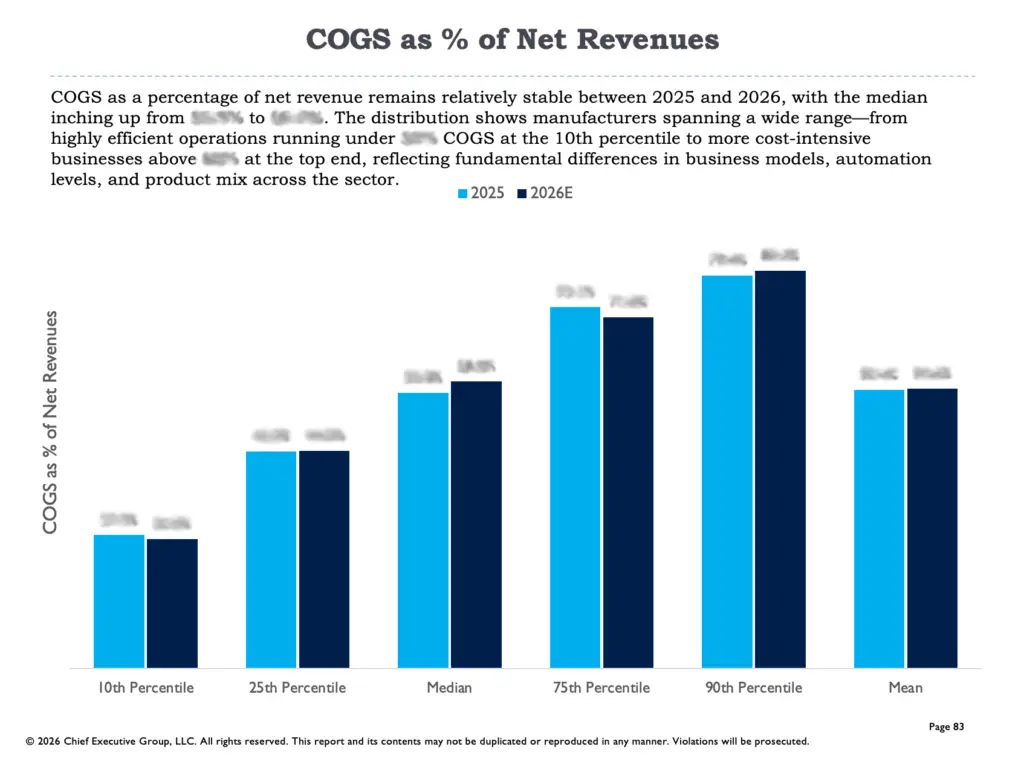
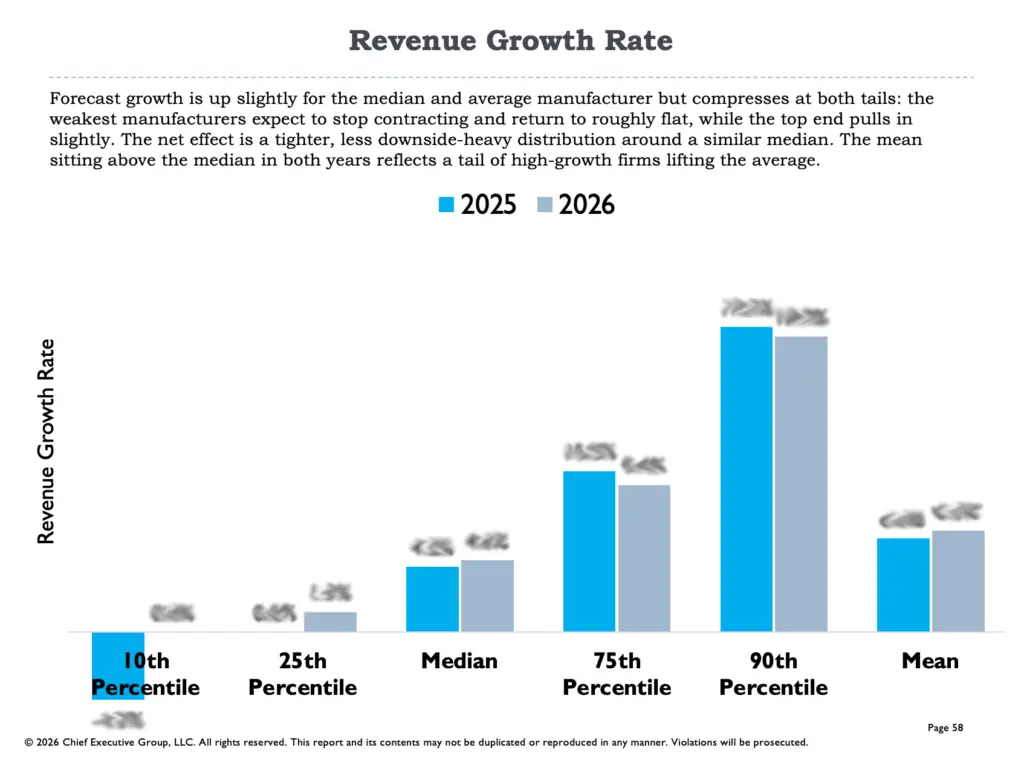
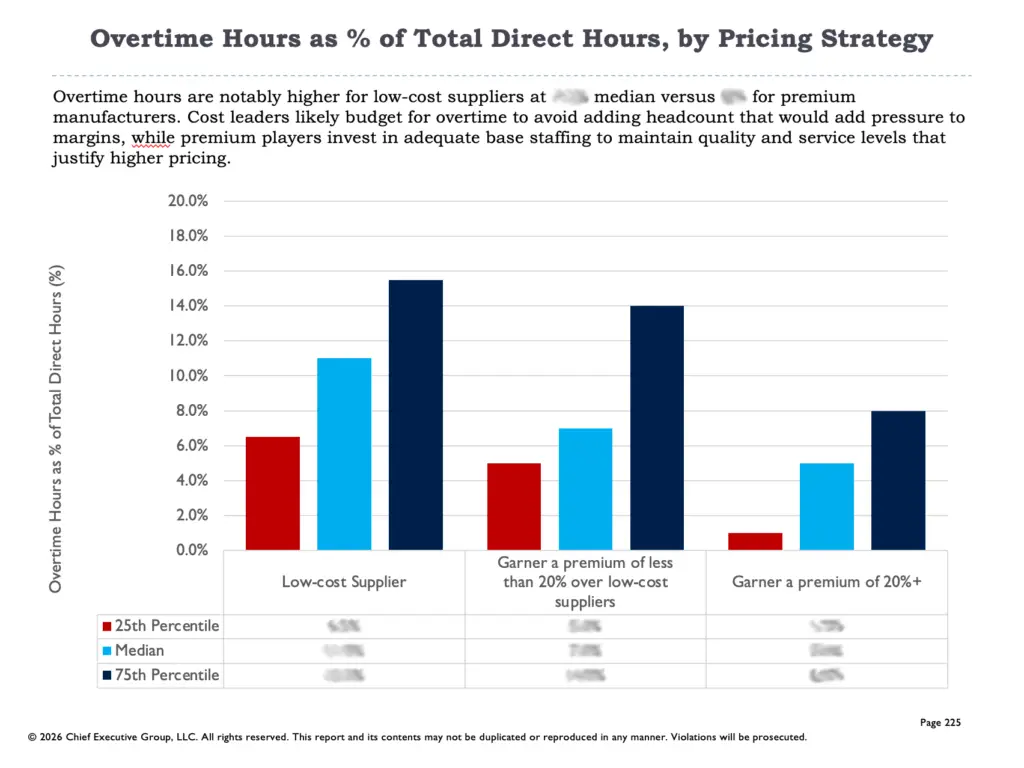
The report includes more than 100 financial, operational and workforce benchmarks, along with detailed analysis and visual comparisons across more than 500 U.S. manufacturers.
Manufacturing leaders face growing pressure to improve profitability, productivity and workforce performance.
Using data from 500 U.S. manufacturers, this report reveals where top performers outperform peers—and where opportunities exist to improve.
Sample Insights from the report
The report goes beyond benchmarking to identify the patterns that separate top-performing manufacturers from the rest of the market.
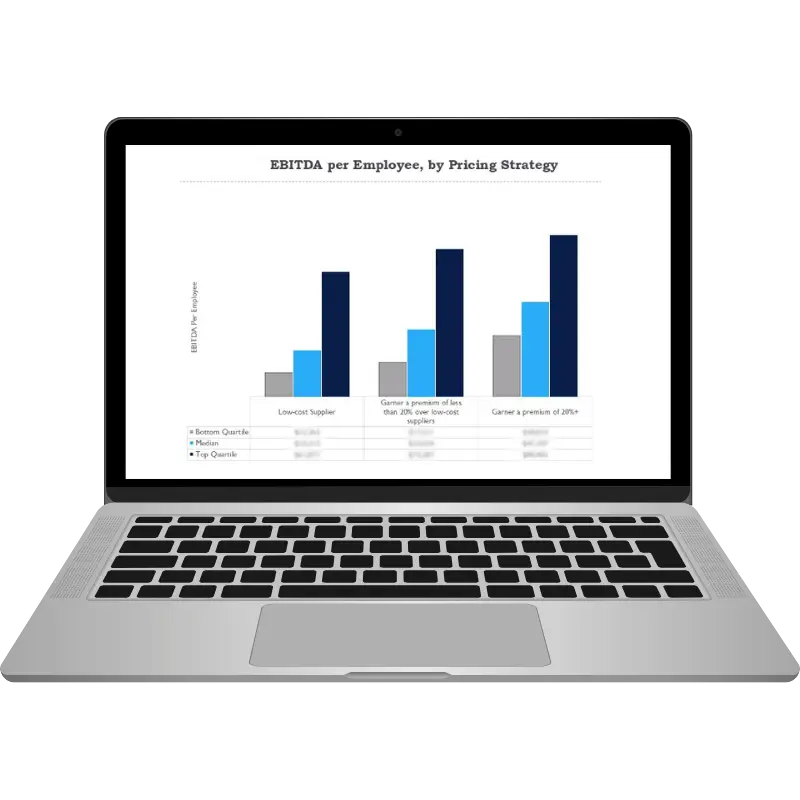
Sample Insight: Manufacturers able to command premium pricing generate substantially higher EBITDA per employee than low-cost competitors. Discover how your organization compares across 100+ financial, operational, workforce and growth benchmarks.
Manufacturers able to command premium pricing generate substantially higher EBITDA per employee than low-cost competitors. Similar analysis is included throughout the report across financial performance, workforce productivity, operational efficiency and growth.
Additional Insights Include:
Sample Insights from the report
The report goes beyond benchmarking to identify the patterns that separate top-performing manufacturers from the rest of the market.
Sample Insight: Manufacturers able to command premium pricing generate substantially higher EBITDA per employee than low-cost competitors. Discover how your organization compares across 100+ financial, operational, workforce and growth benchmarks.
Manufacturers able to command premium pricing generate substantially higher EBITDA per employee than low-cost competitors. Similar analysis is included throughout the report across financial performance, workforce productivity, operational efficiency and growth.
Additional Insights Include:
Compare your company's financial and operational performance against manufacturing peers to validate strategic priorities and identify where improvement efforts should be focused.
Validate margins, cost structure and working capital against comparable manufacturers to support budgeting, capital allocation and financial planning.
Understand how workforce productivity, staffing levels and turnover compare with other manufacturers to support workforce planning and talent decisions.
Compare operational performance against manufacturing peers to identify opportunities to improve efficiency, throughput and resource utilization.
Identify performance gaps, set realistic improvement targets and support continuous improvement initiatives with peer benchmarks.
Support planning, forecasting, budgeting and performance improvement efforts with objective benchmarking data.
A practical benchmarking tool for manufacturing leaders seeking to improve performance, identify opportunities, and make better-informed business decisions.
2026 Financial Performance Benchmarks Report for Manufacturing Companies
Save $200 through December 31, 2026
Regularly $695
0

1:00 - 5:00 pm
Over 70% of Executives Surveyed Agree: Many Strategic Planning Efforts Lack Systematic Approach Tips for Enhancing Your Strategic Planning Process
Executives expressed frustration with their current strategic planning process. Issues include:
Steve Rutan and Denise Harrison have put together an afternoon workshop that will provide the tools you need to address these concerns. They have worked with hundreds of executives to develop a systematic approach that will enable your team to make better decisions during strategic planning. Steve and Denise will walk you through exercises for prioritizing your lists and steps that will reset and reinvigorate your process. This will be a hands-on workshop that will enable you to think about your business as you use the tools that are being presented. If you are ready for a Strategic Planning tune-up, select this workshop in your registration form. The additional fee of $695 will be added to your total.

2:00 - 5:00 pm
Female leaders face the same issues all leaders do, but they often face additional challenges too. In this peer session, we will facilitate a discussion of best practices and how to overcome common barriers to help women leaders be more effective within and outside their organizations.
Limited space available.

10:30 - 5:00 pm
General’s Retreat at Hermitage Golf Course
Sponsored by UBS
General’s Retreat, built in 1986 with architect Gary Roger Baird, has been voted the “Best Golf Course in Nashville” and is a “must play” when visiting the Nashville, Tennessee area. With the beautiful setting along the Cumberland River, golfers of all capabilities will thoroughly enjoy the golf, scenery and hospitality.
The golf outing fee includes transportation to and from the hotel, greens/cart fees, use of practice facilities, and boxed lunch. The bus will leave the hotel at 10:30 am for a noon shotgun start and return to the hotel after the cocktail reception following the completion of the round.