LOOK INSIDE

With data collected directly from the CEOs and Senior Executives of more than 1,800 private companies, you can be confident that you’re offering the right combination of benefits and incentives while maintaining your organization’s integrity and strategic objectives. Leverage this research for the hard data you need to help make critical talent decisions.
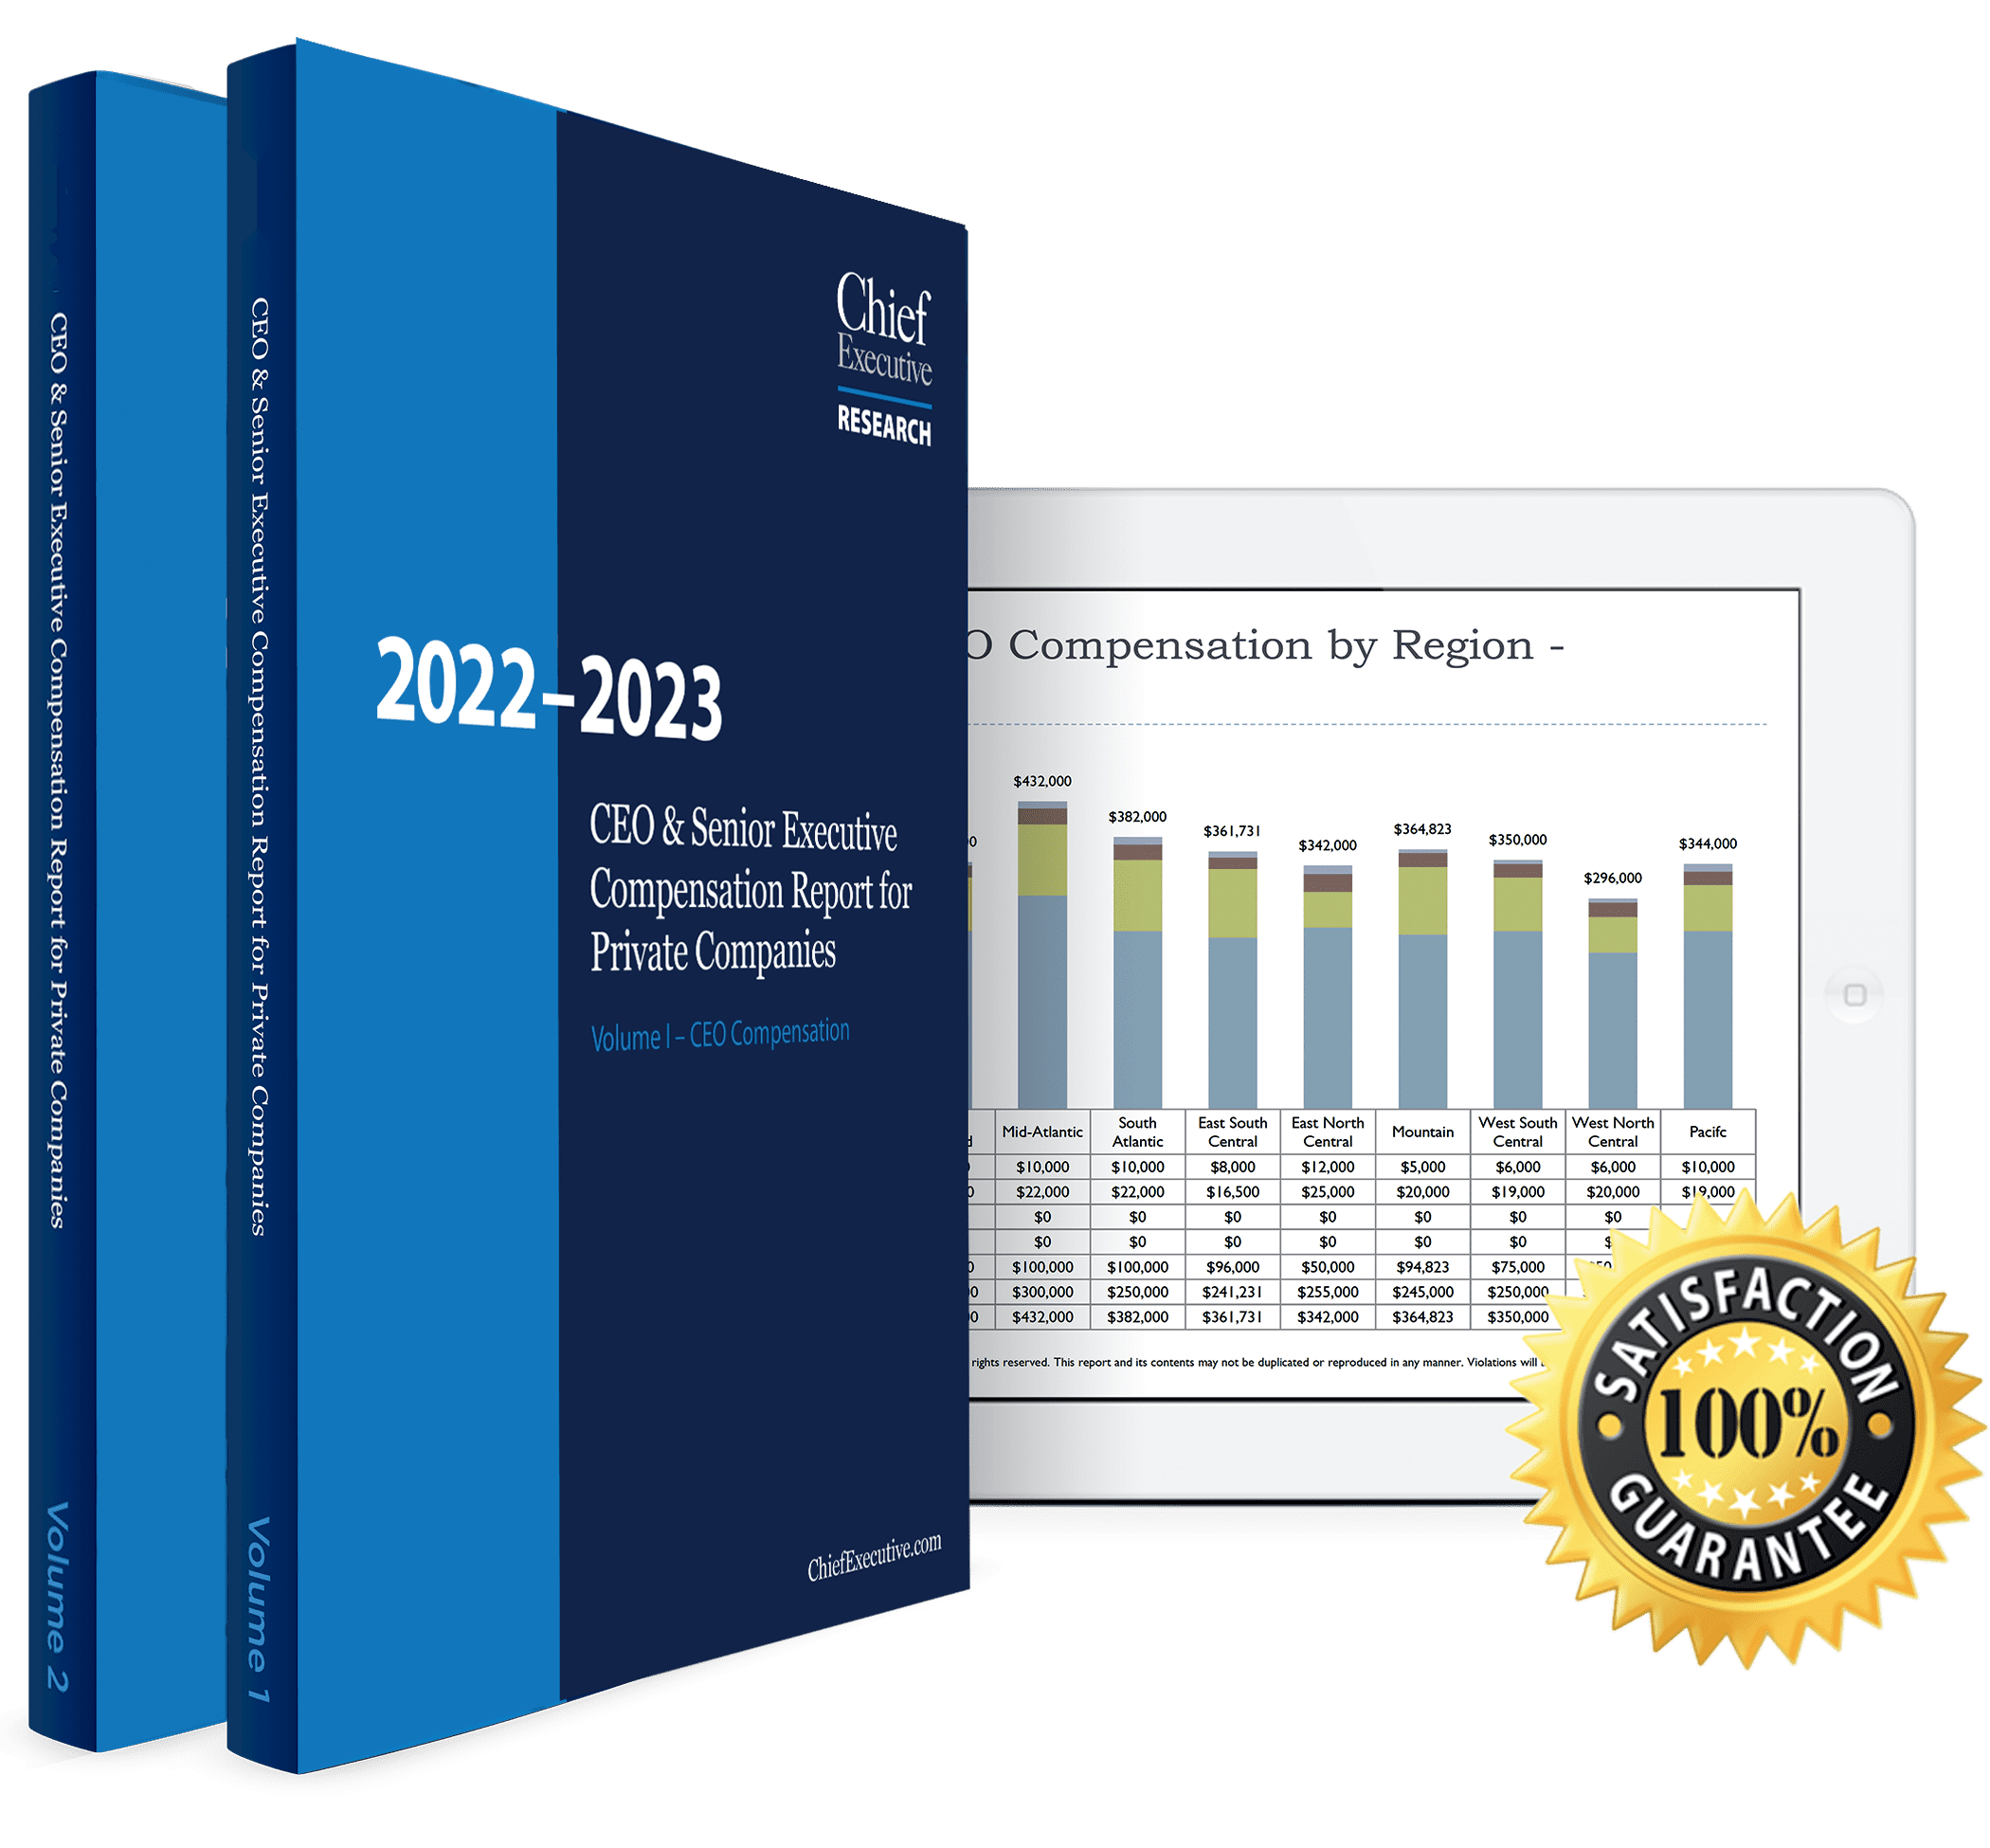
Volume I Data Points:

  • Total Private Company CEO Compensation
  • Expected CEO Cash Compensation This Vs. Prior Year Actual
  • Median Total CEO Compensation by Company Revenue
  • CEO Variable Pay as a Percentage of Salary by Company Revenues – Median
  • Value of CEO Ownership of Company Equity by Company Revenue – Median
  • Total CEO Compensation by Company Revenue – 75th Percentile
  • Value of CEO Ownership of Company Equity by Company Revenue – Top Quartile
  • Correlation Between CEO Compensation and Profitability (Controlling for Company Size)
  • Total CEO Compensation by Industry – Median
  • CEO Bonus as Percentage of Salary by Industry – Median
  • CEO Total Compensation by Company Revenue for Select Industries – Median
  • Total CEO Compensation by Ownership Type – Median
  • CEO Bonus as a Percent of Salary by Ownership Type – Median
  • Total CEO Compensation by Ownership Type Across Company Sizes – Top Quartile
  • Total CEO Compensation by Ownership Type and Company Size – Median
  • CEO Pay Gap Between Public Vs. Private Companies by Company Size – Median
  • Compensation of Other Senior Executives in Private Companies by Title – Median
  • Compensation of Other Senior Executives in Private Companies by Title – Top Quartile
  • Compensation in Private Companies with Less Than $10 Million in Company Revenues – Median
  • Compensation in Private Companies with Less than $10 Million in Company Revenue – Top Quartile
  • Compensation in Private Companies with $10 to $99.9 Million in Company Revenue – Median
  • Compensation in Private Companies with $10 to $99.9 Million in Company Revenue – Top Quartile
  • Compensation in Private Companies with $100 to $999.9 Million in Company Revenue – Median
  • Compensation in Private Companies with $100 to $999.9 Million in Company Revenue – Top Quartile
  • Compensation in Private Companies with $1 Billion + in Company Revenue – Median
  • Compensation in Private Companies with $1 Billion + in Company Revenue – Top Quartile
  • Number of Respondents by Company Revenue
  • Number of Respondents by Number of Employees
  • Number of Respondents by Industry
  • Number of Respondents by Revenue Change in Past Year
  • Number of Respondents by Operating Profit Margin (Defined as EBITDA)
  • Geographic Regions of Respondents
  • CEO Relationship to Company Founder
  • CEO Cash Compensation
  • Actual Bonus Paid as % of Base Salary for Most Recent Year
  • Actual Bonus Paid as % of Target Bonus for Most Recent Year
  • CEO Base Salary vs. Company Revenue
  • CEO Bonus vs. Company Revenue
  • Bonus as Percentage of Salary by Company Revenues – Median
  • CEO Variable Pay as a Percentage of Salary by Company Revenues – Median
  • Change in Bonus by Company Size – Top Quartile
  • CEO Total Cash Compensation by Company Revenue – 25th Quartile
  • CEO Total Cash Compensation by Company Revenue – Median
  • CEO Total Cash Compensation by Company Revenue – 75th Percentile
  • CEO Bonus as a Percentage of Salary by Company Revenues – Top Quartile
  • CEO Base Salary by Number of Employees
  • CEO Bonus by Number of Employees
  • CEO Total Cash Compensation by Number of Employees – Median and Top Quartile
  • CEO Bonus Percentage by Number of Employees – Median
  • CEO Total Cash Compensation by Level of Operating Profit – Median and Top Quartile
  • CEO Total Cash Compensation by Level of Operating Profit Among Companies with Revenues Less Than $10 Million – Median
  • CEO Total Cash Compensation by Level of Operating Profit Among Companies with Revenues of $10 Million to $99.9 Million – Median
  • CEO Total Cash Compensation by Level of Operating Profit Among Companies with Revenues of $100 to $999.9 Million – Median
  • CEO Total Cash Compensation by Level of Operating Profit Among Companies with Revenues Over $1 Billion – Median
  • CEO Bonus Percentage by Level of Operating Profit – 25th to 75th Percentile
  • CEO Total Cash Compensation by Revenue Growth Rate – Median and Top Quartile
  • CEO Total Cash Compensation by Revenue Growth Rate Among Companies with Revenues Less Than $10 Million – Median
  • CEO Total Cash Compensation by Revenue Growth Rate Among Companies with Revenues of $10 Million to $99.9 Million – Median
  • CEO Total Cash Compensation by Revenue Growth Rate Companies with Revenues of $100 to $999.9 Million – Median
  • CEO Total Cash Compensation by Revenue Growth Rate Among Companies with Revenues Over $1 Billion – Median
  • CEO Bonus Percentage by Revenue Growth Rate – 25th to 75th Percentile
  • CEO Base Salaries by Industry – 25th to 75th Percentile
  • Change in CEO Salary Compared to Year Prior by Industry – Top Quartile
  • CEO Bonus by Industry – 25th to 75th Percentile
  • CEO Bonus Percentage by Industry – Median
  • Total CEO Cash Compensation by Industry – Median
  • CEO Cash Compensation by Company Revenue for Select Industries – Median
  • CEO Base Salary by Ownership Type – 25th to 75th Percentile
  • CEO Bonus by Ownership Type – 25th to 75th Percentile
  • CEO Bonus as a Percent of Salary by Ownership Type – Median
  • CEO Total Cash Compensation by Ownership Type Across All Revenue Sizes – Median and Top Quartile
  • CEO Total Cash Compensation by Ownership Type Among Companies with Revenues Less Than $10 Million – Median
  • CEO Total Cash Compensation by Ownership Type Among Companies with Revenues of $10 to $99.9 Million – Median
  • CEO Total Cash Compensation by Ownership Type Among Companies with Revenues of $100 to $999 Million – Median
  • CEO Total Cash Compensation by Ownership Type Among Companies with Revenues of $1 Billion + – Median
  • CEO Cash Compensation in Sole Proprietorships by Company Size and Percentile
  • CEO Cash Compensation in Partnerships by Company Size and Percentile
  • CEO Cash Compensation in Family-Owned Companies by Company Size and Percentile
  • CEO Cash Compensation in Employee-Owned Companies by Company Size and Percentile
  • CEO Cash Compensation in Venture Capital Owned Companies by Company Size and Percentile
  • CEO Cash Compensation in Private Equity Owned Companies by Company Size and Percentile
  • CEO Cash Compensation in Other Types of Private Ownership by Company Size and Percentile
  • CEO Cash Compensation in Public Companies by Company Size and Percentile
  • CEO Base Salary by Labor Market – 25th to 75th Percentile
  • CEO Bonus by Labor Market – 25th to 75th Percentile
  • Median CEO Total Cash Compensation by Labor Market Across All Revenue Sizes – Median and Top Quartile
  • Median CEO Bonus as a Percentage of Base Salary by Labor Market (Across All Revenue Sizes) – Median
  • Median CEO Total Cash Compensation by Labor Market Among Companies with Revenues Less Than $10 Million – Median
  • Median CEO Total Cash Compensation by Labor Market Among Companies with Revenues of $10 to $99.9 Million – Median
  • Median CEO Total Cash Compensation by Labor Market Among Companies with Revenues of $100 to $999.9 Million – Median
  • Median CEO Total Cash Compensation by Labor Market Among Companies with Revenues of $1 Billion + – Median
  • CEO Base Salary by Region – 25th to 75th Percentile
  • CEO Bonus by Region – 25th to 75th Percentile
  • CEO Total Cash Compensation by Region Across All Revenue Sizes – Median
  • Expected CEO Cash Compensation
  • Expected CEO Cash Compensation by Company Revenue – Median and Top Quartile
  • Expected CEO Cash Compensation by Number of Employees – Median and Top Quartile
  • Expected CEO Cash Compensation by Industry – Median and Top Quartile
  • Expected CEO Cash Compensation by Ownership Type – Median and Top Quartile
  • Expected CEO Cash Compensation by Region – Median and Top Quartile
  • Expected CEO Cash Compensation by Labor Market – Median and Top Quartile
  • Expected Bonus for the CEO as % of Current Salary
  • CEO Equity Gains Last Year and Total Equity Value – Across All Companies
  • CEO Percentage Ownership of Company Equity – Across All Companies
  • CEO Equity Gains Last Year and Total Equity Value by Company Revenue – Median and Top Quartile
  • CEO Percentage Ownership of Company Equity by Company Revenue
  • CEO Equity Gains Last Year and Total Equity Value by Number of Employees – Median and Top Quartile
  • CEO Percentage Ownership of Company Equity by Number of Employees
  • CEO Equity Gains Last Year and Total Equity Value by Ownership Type– Median and Top Quartile
  • CEO Percentage Ownership of Company Equity by Ownership Type
  • CEO Equity Gains Last Year and Total Equity Value by Level of Profitability – Median and Top Quartile
  • CEO Percentage Ownership of Company Equity by Level of Profitability
  • CEO Equity Gains Last Year and Total Equity Value by Revenue Growth Rate – Median and Top Quartile
  • CEO Percentage Ownership of Company Equity by Revenue Growth Rate
  • CEO Equity Gains Last Year and Total Equity Value by Industry – Median and Top Quartile
  • CEO Percentage Ownership of Company Equity by Industry
  • CEO Equity Gains Last Year and Total Equity Value by Region – Median and Top Quartile
  • CEO Percentage Ownership of Company Equity by Region
  • CEO Equity Gains Last Year and Total Equity Value by Labor Market – Median and Top Quartile
  • CEO Percentage Ownership of Company Equity by Labor Market
  • Prevalence of Specific Benefits
  • Percent of Companies Offering Benefit by Company Revenue
  • Percent of Companies Offering Benefit by Number of Employees
  • Percent of Companies Offering Benefit by Ownership Type
  • Prevalence of Specific Perquisites
  • Percent of Companies Offering Perquisite by Company Revenue
  • Percent of Companies Offering Perquisite by Number of Employees
  • Percent of Companies Offering Perquisite by Ownership Type
  • Value of CEO Benefits
  • Value of CEO Perquisites
  • CEO Benefits and Perks Value by Company Revenue – Median and Top Quartile
  • CEO Benefits and Perks Value by Number of Employees – Median and Top Quartile
  • CEO Benefits and Perks Value by Industry – Median and Top Quartile
  • CEO Benefits and Perks Value by Ownership Type – Median and Top Quartile
  • Existence of Severance Agreement in Place if CEO’s Employment is Terminated
  • Total CEO Compensation
  • Total CEO Compensation by Company Revenue – Median and Top Quartile
  • Total CEO Compensation by Number of Employees – Median and Top Quartile
  • Total CEO Compensation by Industry – Median and Top Quartile
  • CEO Total Compensation by Company Revenue for Select Industries – Median
  • Total CEO Compensation by Ownership Type – Median and Top Quartile
  • Total CEO Compensation by Ownership Type and Company Size – Median
  • Total CEO Compensation by Profitability Across All Sized Companies – Median and Top Quartile
  • Total CEO Compensation by Profitability and Company Size – Median
  • Total CEO Compensation by Revenue Change – Median and Top Quartile
  • Total CEO Compensation by Revenue Change and Company Size – Median
  • Total CEO Compensation by Labor Market – Median and Top Quartile
  • Total CEO Compensation by Labor Market and Company Size – Median
  • Total CEO Compensation by Region – Median and Top Quartile
  • Who Approves CEO Compensation Packages Percentage of Companies by Company Revenue
  • Who Approves CEO Compensation Packages Percentage of Companies by Ownership Type
  • Companies with Formal Annual Incentive Plans for Executives by Company Revenue
  • Companies with Formal Annual Incentive Plans for Executives by Ownership Type
  • Basis for Total Amount of Bonus Payments by Company Revenue
  • Basis for Total Amount of Bonus Payments by Ownership Type
  • Companies with Formal Long-Term Incentive Plans by Company Revenue
  • Companies with Formal Long-Term Incentive Plans by Ownership Type
  • Eligibility for Long-Term Incentives by Company Revenue
  • Eligibility for Long-Term Incentives by Ownership Type
  • Companies with Formal Salary Plan with Regularly Scheduled Reviews by Company Revenue
  • Companies with Formal Salary Plan with Regularly Scheduled Reviews by Ownership Type
  • Companies that Set Salary Ranges for Specific Positions by Company Revenue
  • Companies that Set Salary Ranges for Specific Positions by Ownership Type
  • Companies that Use an Objective Formula for the Size of Pay Increases by Company Revenue
  • Companies that Use an Objective Formula for the Size of Pay Increases by Ownership Type
  • Companies with Performance Ratings Tied to Specific Salary Increases by Company Revenue
  • Companies with Performance Ratings Tied to Specific Salary Increases by Ownership Type
  • Companies where Titles and Responsibilities are Reviewed Annually by Company Revenue
  • Companies where Titles and Responsibilities are Reviewed Annually by Ownership Type
  • Companies that Consider the Relative Value/Impact Internally Among Positions by Company Revenue
  • Companies that Consider the Relative Value/Impact Internally Among Positions by Ownership Type
  • Companies that Monitor Local Salary Ranges for Comparable Positions to Remain Competitive by Company Revenue
  • Companies that Monitor Local Salary Ranges for Comparable Positions to Remain Competitive by Ownership Type
  • Companies that Monitor Salary Ranges Beyond the Local Market to Remain Competitive by Company Revenue
  • Companies that Monitor Salary Ranges Beyond the Local Market to Remain Competitive by Ownership Type
  • Use of Long-Term Incentive Vehicles Percentage by Company Revenue
  • Use of Long-Term Incentive Vehicles Percentage by Ownership Type
  • How Companies Value Stock and Option Awards by Company Revenue
  • How Companies Value Stock and Option Awards Percentage by Ownership Type
  • Vesting of Equity Incentives
  • Employees Put Up Funds to Invest
  • Best Practices


Volume II Data Points:

  • Total President Compensation
  • Total President Compensation by Company Revenue – Median and Top Quartile
  • Change in President Base Salary by Company Size
  • President Variable Pay as a Percentage of Salary by Company Revenues – Median
  • Total President Compensation by Number of Employees – Median and Top Quartile
  • Total President Compensation by Profitability – Median and Top Quartile
  • President Bonus as a Percent of Salary by Level of Profitability
  • Total President Compensation by Revenue Growth Rate – Median and Top Quartile
  • President Bonus as Percentage of Salary by Revenue Growth Rate
  • Total President Compensation by Industry – Median and Top Quartile
  • President Bonus as Percentage of Base Salary by Industry – Median
  • Total President Compensation by Ownership Type – Median and Top Quartile
  • President Bonus as a Percent of Salary by Ownership Type – Median
  • Total President Compensation by Region – Median and Top Quartile
  • Total President Compensation by Labor Market – Median and Top Quartile
  • Expected President Cash Compensation
  • Expected President Cash Compensation by Company Revenue – Median and Top Quartile
  • Expected President Cash Compensation by Number of Employees – Median and Top Quartile
  • Expected President Cash Compensation by Industry – Median and Top Quartile
  • Expected President Cash Compensation by Ownership Type – Median and Top Quartile
  • Expected President Cash Compensation by Region – Median and Top Quartile
  • Expected President Cash Compensation by Labor Market – Median and Top Quartile
  • Total COO Compensation
  • Total COO Compensation by Company Revenue – Median and Top Quartile
  • Change in COO Base Salary by Company Size
  • COO Variable Pay as a Percentage of Salary by Company Revenues – Median
  • Total COO Compensation by Number of Employees – Median and Top Quartile
  • Total COO Compensation by Profitability – Median and Top Quartile
  • COO Bonus as a Percent of Salary by Level of Profitability
  • Total COO Compensation by Revenue Growth Rate – Median and Top Quartile
  • COO Bonus as Percentage of Salary by Revenue Growth Rate
  • Total COO Compensation by Industry – Median and Top Quartile
  • COO Bonus as Percentage of Base Salary by Industry – Median
  • Total COO Compensation by Ownership Type – Median and Top Quartile
  • COO Bonus as a Percent of Salary by Ownership Type – Median
  • Total COO Compensation by Region – Median and Top Quartile
  • Total COO Compensation by Labor Market – Median and Top Quartile
  • Expected COO Cash Compensation
  • Expected COO Cash Compensation by Company Revenue – Median and Top Quartile
  • Expected COO Cash Compensation by Number of Employees – Median and Top Quartile
  • Expected COO Cash Compensation by Industry – Median and Top Quartile
  • Expected COO Cash Compensation by Ownership Type – Median and Top Quartile
  • Expected COO Cash Compensation by Region – Median and Top Quartile
  • Expected COO Cash Compensation by Labor Market – Median and Top Quartile
  • Total CFO Compensation
  • Total CFO Compensation by Company Revenue – Median and Top Quartile
  • Change in CFO Base Salary by Company Size
  • CFO Variable Pay as a Percentage of Salary by Company Revenues – Median
  • Total CFO Compensation by Number of Employees – Median and Top Quartile
  • Total CFO Compensation by Profitability – Median and Top Quartile
  • CFO Bonus as a Percent of Salary by Level of Profitability
  • Total CFO Compensation by Revenue Growth Rate – Median and Top Quartile
  • CFO Bonus as Percentage of Salary by Revenue Growth Rate
  • Total CFO Compensation by Industry – Median and Top Quartile
  • CFO Bonus as Percentage of Base Salary by Industry – Median
  • Total CFO Compensation by Ownership Type – Median and Top Quartile
  • CFO Bonus as a Percent of Salary by Ownership Type – Median
  • Total CFO Compensation by Region – Median and Top Quartile
  • Total CFO Compensation by Labor Market – Median and Top Quartile
  • Expected CFO Cash Compensation
  • Expected CFO Cash Compensation by Company Revenue – Median and Top Quartile
  • Expected CFO Cash Compensation by Number of Employees – Median and Top Quartile
  • Expected CFO Cash Compensation by Industry – Median and Top Quartile
  • Expected CFO Cash Compensation by Ownership Type – Median and Top Quartile
  • Expected CFO Cash Compensation by Region – Median and Top Quartile
  • Expected CFO Cash Compensation by Labor Market – Median and Top Quartile
  • Total CMO Compensation
  • Total CMO Compensation by Company Revenue – Median and Top Quartile
  • Change in CMO Base Salary by Company Size
  • CMO Variable Pay as a Percentage of Salary by Company Revenues – Median
  • Total CMO Compensation by Number of Employees – Median and Top Quartile
  • Total CMO Compensation by Profitability – Median and Top Quartile
  • CMO Bonus as a Percent of Salary by Level of Profitability
  • Total CMO Compensation by Revenue Growth Rate – Median and Top Quartile
  • CMO Bonus as Percentage of Salary by Revenue Growth Rate
  • Total CMO Compensation by Industry – Median and Top Quartile
  • CMO Bonus as Percentage of Base Salary by Industry – Median
  • Total CMO Compensation by Ownership Type – Median and Top Quartile
  • CMO Bonus as a Percent of Salary by Ownership Type – Median
  • Total CMO Compensation by Region – Median and Top Quartile
  • Total CMO Compensation by Labor Market – Median and Top Quartile
  • Expected CMO Cash Compensation
  • Expected CMO Cash Compensation by Company Revenue – Median and Top Quartile
  • Expected CMO Cash Compensation by Number of Employees – Median and Top Quartile
  • Expected CMO Cash Compensation by Industry – Median and Top Quartile
  • Expected CMO Cash Compensation by Ownership Type – Median and Top Quartile
  • Expected CMO Cash Compensation by Region – Median and Top Quartile
  • Expected CMO Cash Compensation by Labor Market – Median and Top Quartile
  • Total CSO Compensation
  • Total CSO Compensation by Company Revenue – Median and Top Quartile
  • Change in CSO Base Salary by Company Size
  • CSO Variable Pay as a Percentage of Salary by Company Revenues – Median
  • Total CSO Compensation by Number of Employees – Median and Top Quartile
  • Total CSO Compensation by Profitability – Median and Top Quartile
  • CSO Bonus as a Percent of Salary by Level of Profitability
  • Total CSO Compensation by Revenue Growth Rate – Median and Top Quartile
  • CSO Bonus as Percentage of Salary by Revenue Growth Rate
  • Total CSO Compensation by Industry – Median and Top Quartile
  • CSO Bonus as Percentage of Base Salary by Industry – Median
  • Total CSO Compensation by Ownership Type – Median and Top Quartile
  • CSO Bonus as a Percent of Salary by Ownership Type – Median
  • Total CSO Compensation by Region – Median and Top Quartile
  • Total CSO Compensation by Labor Market – Median and Top Quartile
  • Expected CSO Cash Compensation
  • Expected CSO Cash Compensation by Company Revenue – Median and Top Quartile
  • Expected CSO Cash Compensation by Number of Employees – Median and Top Quartile
  • Expected CSO Cash Compensation by Industry – Median and Top Quartile
  • Expected CSO Cash Compensation by Ownership Type – Median and Top Quartile
  • Expected CSO Cash Compensation by Region – Median and Top Quartile
  • Expected CSO Cash Compensation by Labor Market – Median and Top Quartile
  • Total CIO Compensation
  • Total CIO Compensation by Company Revenue – Median and Top Quartile
  • Change in CIO Base Salary by Company Size
  • CIO Variable Pay as a Percentage of Salary by Company Revenues – Median
  • Total CIO Compensation by Number of Employees – Median and Top Quartile
  • Total CIO Compensation by Profitability – Median and Top Quartile
  • CIO Bonus as a Percent of Salary by Level of Profitability
  • Total CIO Compensation by Revenue Growth Rate – Median and Top Quartile
  • CIO Bonus as Percentage of Salary by Revenue Growth Rate
  • Total CIO Compensation by Industry – Median and Top Quartile
  • CIO Bonus as Percentage of Base Salary by Industry – Median
  • Total CIO Compensation by Ownership Type – Median and Top Quartile
  • CIO Bonus as a Percent of Salary by Ownership Type – Median
  • Total CIO Compensation by Region – Median and Top Quartile
  • Total CIO Compensation by Labor Market – Median and Top Quartile
  • Expected CIO Cash Compensation
  • Expected CIO Cash Compensation by Company Revenue – Median and Top Quartile
  • Expected CIO Cash Compensation by Number of Employees – Median and Top Quartile
  • Expected CIO Cash Compensation by Industry – Median and Top Quartile
  • Expected CIO Cash Compensation by Ownership Type – Median and Top Quartile
  • Expected CIO Cash Compensation by Region – Median and Top Quartile
  • Expected CIO Cash Compensation by Labor Market – Median and Top Quartile
  • Total Head of R&D Compensation
  • Total Head of R&D Compensation by Company Revenue – Median and Top Quartile
  • Change in Head of R&D Base Salary by Company Size
  • Head of R&D Variable Pay as a Percentage of Salary by Company Revenues – Median
  • Total Head of R&D Compensation by Number of Employees – Median and Top Quartile
  • Total Head of R&D Compensation by Profitability – Median and Top Quartile
  • Head of R&D Bonus as a Percent of Salary by Level of Profitability
  • Total Head of R&D Compensation by Revenue Growth Rate – Median and Top Quartile
  • Head of R&D Bonus as Percentage of Salary by Revenue Growth Rate
  • Total Head of R&D Compensation by Industry – Median and Top Quartile
  • Head of R&D Bonus as Percentage of Base Salary by Industry – Median
  • Total Head of R&D Compensation by Ownership Type – Median and Top Quartile
  • Head of R&D Bonus as a Percent of Salary by Ownership Type – Median
  • Total Head of R&D Compensation by Region – Median and Top Quartile
  • Total Head of R&D Compensation by Labor Market – Median and Top Quartile
  • Expected Head of R&D Cash Compensation
  • Expected Head of R&D Cash Compensation by Company Revenue – Median and Top Quartile
  • Expected Head of R&D Cash Compensation by Number of Employees – Median and Top Quartile
  • Expected Head of R&D Cash Compensation by Industry – Median and Top Quartile
  • Expected Head of R&D Cash Compensation by Ownership Type – Median and Top Quartile
  • Expected Head of R&D Cash Compensation by Region – Median and Top Quartile
  • Expected Head of R&D Cash Compensation by Labor Market – Median and Top Quartile
  • Total CHRO Compensation
  • Total CHRO Compensation by Company Revenue – Median and Top Quartile
  • Change in CHRO Base Salary by Company Size
  • CHRO Variable Pay as a Percentage of Salary by Company Revenues – Median
  • Total CHRO Compensation by Number of Employees – Median and Top Quartile
  • Total CHRO Compensation by Profitability – Median and Top Quartile
  • CHRO Bonus as a Percent of Salary by Level of Profitability
  • Total CHRO Compensation by Revenue Growth Rate – Median and Top Quartile
  • CHRO Bonus as Percentage of Salary by Revenue Growth Rate
  • Total CHRO Compensation by Industry – Median and Top Quartile
  • CHRO Bonus as Percentage of Base Salary by Industry – Median
  • Total CHRO Compensation by Ownership Type – Median and Top Quartile
  • CHRO Bonus as a Percent of Salary by Ownership Type – Median
  • Total CHRO Compensation by Region – Median and Top Quartile
  • Total CHRO Compensation by Labor Market – Median and Top Quartile
  • Expected CHRO Cash Compensation
  • Expected CHRO Cash Compensation by Company Revenue – Median and Top Quartile
  • Expected CHRO Cash Compensation by Number of Employees – Median and Top Quartile
  • Expected CHRO Cash Compensation by Industry – Median and Top Quartile
  • Expected CHRO Cash Compensation by Ownership Type – Median and Top Quartile
  • Expected CHRO Cash Compensation by Region – Median and Top Quartile
  • Expected CHRO Cash Compensation by Labor Market – Median and Top Quartile
  • Prevalence of Specific Benefits for Senior Executives
  • Percent of Companies Offering Benefit by Company Revenue
  • Percent of Companies Offering Benefit by Number of Employees
  • Percent of Companies Offering Benefit by Ownership Type
  • Prevalence of Specific Perquisites for Senior Executives
  • Percent of Companies Offering Perquisite by Company Revenue
  • Percent of Companies Offering Perquisite by Number of Employees
  • Percent of Companies Offering Perquisite by Ownership Type
  • Value of Senior Executive Benefits
  • Value of Senior Executive Perquisites
  • Senior Executive Benefits and Perks Value by Company Revenue – Median and Top Quartile
  • Senior Executive Benefits and Perks Value by Number of Employees – Median and Top Quartile
  • Senior Executive Benefits and Perks Value by Ownership Type – Median and Top Quartile
  • Senior Executive Benefits and Perks Value by Industry – Median and Top Quartile
 
 
2022-2023 report cover

Get Compensation Data from Thousands of Private U.S. Companies​

Roundtable

Strategic Planning Workshop

1:00 - 5:00 pm

Over 70% of Executives Surveyed Agree: Many Strategic Planning Efforts Lack Systematic Approach Tips for Enhancing Your Strategic Planning Process

Executives expressed frustration with their current strategic planning process. Issues include:

  1. Lack of systematic approach (70%)
  2. Laundry lists without prioritization (68%)
  3. Decisions based on personalities rather than facts and information (65%)


Steve Rutan and Denise Harrison have put together an afternoon workshop that will provide the tools you need to address these concerns.  They have worked with hundreds of executives to develop a systematic approach that will enable your team to make better decisions during strategic planning.  Steve and Denise will walk you through exercises for prioritizing your lists and steps that will reset and reinvigorate your process.  This will be a hands-on workshop that will enable you to think about your business as you use the tools that are being presented.  If you are ready for a Strategic Planning tune-up, select this workshop in your registration form.  The additional fee of $695 will be added to your total.

To sign up, select this option in your registration form. Additional fee of $695 will be added to your total.

New York, NY: ​​​Chief Executive's Corporate Citizenship Awards 2017

Women in Leadership Seminar and Peer Discussion

2:00 - 5:00 pm

Female leaders face the same issues all leaders do, but they often face additional challenges too. In this peer session, we will facilitate a discussion of best practices and how to overcome common barriers to help women leaders be more effective within and outside their organizations. 

Limited space available.

To sign up, select this option in your registration form. Additional fee of $495 will be added to your total.

Golf Outing

10:30 - 5:00 pm
General’s Retreat at Hermitage Golf Course
Sponsored by UBS

General’s Retreat, built in 1986 with architect Gary Roger Baird, has been voted the “Best Golf Course in Nashville” and is a “must play” when visiting the Nashville, Tennessee area. With the beautiful setting along the Cumberland River, golfers of all capabilities will thoroughly enjoy the golf, scenery and hospitality.

The golf outing fee includes transportation to and from the hotel, greens/cart fees, use of practice facilities, and boxed lunch. The bus will leave the hotel at 10:30 am for a noon shotgun start and return to the hotel after the cocktail reception following the completion of the round.

To sign up, select this option in your registration form. Additional fee of $295 will be added to your total.