| RATINGS1 | DEVELOPMENT TREND INDICATOR | ||||||
|---|---|---|---|---|---|---|---|
| STATE | TAXATION AND REGULATION |
WORKFORCE QUALITY |
LIVING | DIRECTION | COMMENT | ||
| Alabama | 6.59 | 6.06 | 6.41 | ↑ | Change in political control unleashes efforts to tackle businesses’ concerns. | ||
| Alaska | 6.65 | 5.30 | 4.85 | ↔ | Light tax burden struggles to overcome other impediments to competitiveness. | ||
| Arizona | 6.91 | 6.72 | 7.13 | ↑ | Entrepreneurial activity surges as companies hope for personal-property tax relief. | ||
| Arkansas | 6.63 | 6.05 | 6.75 | ↔ | Agreeable environment on taxes and other business concerns continues. | ||
| California | 1.74 | 5.82 | 6.73 | ↓ | Sucking sound continues as frustrated businesses leave state for friendlier climes. | ||
| Colorado | 6.48 | 7.74 | 8.55 | ↔ | Business has backed health-insurance exchange; entrepreneurs still like the mountains. | ||
| Connecticut | 2.61 | 6.76 | 6.24 | ↔ | Businesses in high-tax state bracing for possible boost in minimum wage. | ||
| Delaware | 7.81 | 7.39 | 7.36 | ↔ | Entrepreneurs buck economy but companies fret about push to raise minimum wage. | ||
| Florida | 7.27 | 6.73 | 8.07 | ↑ | New tax relief—and boosterish Gov. Scott—excite owners and executives. | ||
| Georgia | 6.61 | 7.31 | 7.55 | ↑ | More conservative statehouse holds line on taxes; workforce becomes major plus. | ||
| Hawaii | 2.92 | 4.26 | 8.66 | ↔ | Tax-and-regulate approach to business also stifles entrepreneurial gains. | ||
| Idaho | 7.18 | 7.69 | 8.28 | ↔ | Keeps entrepreneurs happy with fewest health mandates of any state. | ||
| Illinois | 2.31 | 5.84 | 5.11 | ↓ | New tax burdens drive business-unfriendliness to new lows. | ||
| Indiana | 7.40 | 7.73 | 7.27 | ↑ | Becoming right-to-work state already making it a bigger magnet for business. | ||
| Iowa | 6.42 | 7.70 | 7.19 | ↑ | Does better job of harnessing locational possibilities for food technology. | ||
| Kansas | 6.75 | 7.55 | 6.80 | ↔ | Inches up in several new measures of business friendliness. | ||
| Kentucky | 5.84 | 6.68 | 6.61 | ↓ | State focus on gambling issue robs attention from needed business reforms. | ||
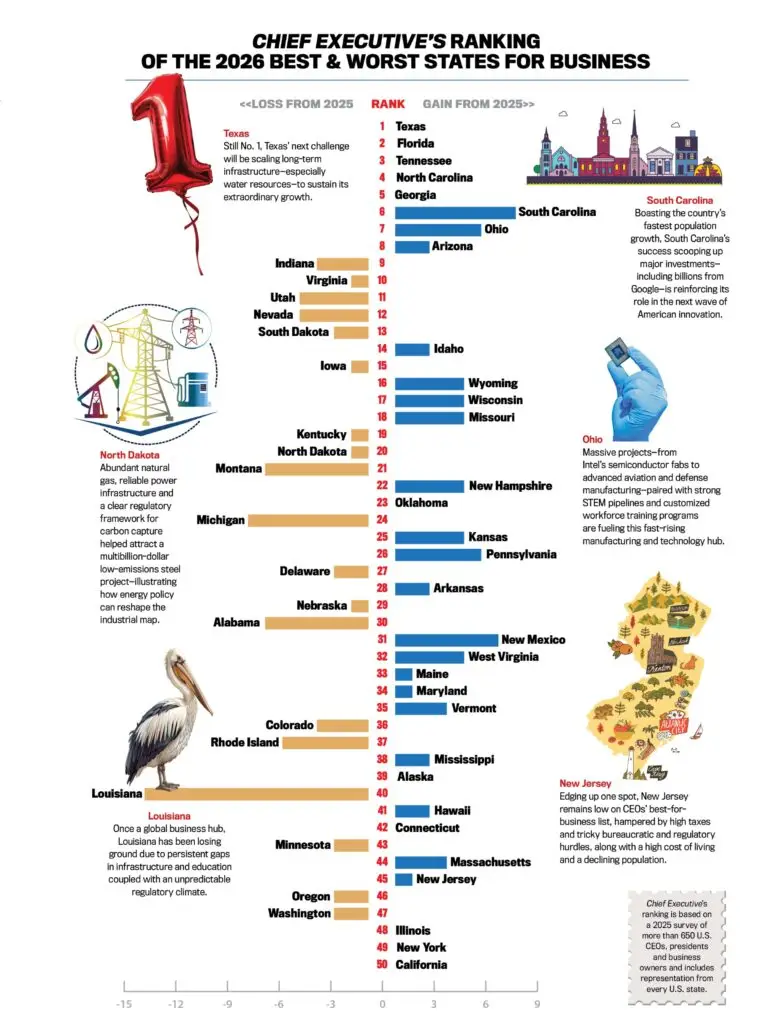
| Louisiana | 7.03 | 6.83 | 7.21 | ↑ | Surge in business-friendliness continues with reforms in education and public pensions. | ||
| Maine | 3.75 | 6.33 | 7.25 | ↑ | New governor’s tax cuts gain business favor and spur some job growth. | ||
| Maryland | 3.63 | 6.34 | 6.08 | ↓ | Income-tax increases on “middle class” nick and frustrate business owners. | ||
| Massachusetts | 2.33 | 6.39 | 5.43 | ↔ | Entrepreneurs leveraging brainpower, but new family-leave law bites companies. | ||
| Michigan | 3.44 | 5.19 | 4.56 | ↑ | Tax cuts and simplification bode well for future under new Gov. Snyder. | ||
| Minnesota | 3.82 | 7.14 | 6.57 | ↓ | Divided statehouse stalls progress on tort reform and other business concerns. | ||
| Mississippi | 5.81 | 5.10 | 5.14 | ↑ | Business-friendly politics are newly in the air, encouraging companies and owners. | ||
| Missouri | 5.71 | 6.42 | 6.57 | ↔ | Surges in entrepreneurial activity and holds its own in tax climate for business. | ||
| Montana | 7.35 | 6.85 | 7.85 | ↑ | Politicians address effects of dangerous jobs in boosting worker’s comp rates. | ||
| Nebraska | 7.47 | 7.82 | 7.24 | ↓ | Tax-friendliness can’t overcome other stresses on business and job creation. | ||
| Nevada | 8.03 | 6.33 | 6.53 | ↑ | New Gov. Sandoval whacks regulations to try to jump-start moribund economy. | ||
| New Hampshire | 6.91 | 7.17 | 7.52 | ↔ | Statehouse continues tax-friendly ways and nurtures entrepreneurial spark. | ||
| New Jersey | 2.95 | 6.00 | 5.04 | ↑ | Gov. Christie’s boldness rallies business, but possible minimage-wage boost looms. | ||
| New Mexico | 4.75 | 4.90 | 6.35 | ↔ | Businesses would like to see more progress on regulatory morass. | ||
| New York | 2.12 | 6.11 | 5.09 | ↔ | Gov. Cuomo has pleasantly surprised business but plenty of problems remain. | ||
| North Carolina | 7.09 | 7.95 | 8.41 | ↓ | Stalled recently on issues including tort reform, school funding and taxes. | ||
| North Dakota | 8.65 | 7.61 | 5.87 | ↑ | Drilling makes frothy economy ever better, creating growth and opportunity. | ||
| Ohio | 4.25 | 6.38 | 5.89 | ↑ | Public-pension ploy didn’t work, but bellwether state is going business-friendly. | ||
| Oklahoma | 7.31 | 7.14 | 6.74 | ↔ | Business-friendliness keeps bringing influx of workers and companies. | ||
| Oregon | 3.50 | 5.73 | 6.95 | ↓ | Slips in a year when battle over health-insurance exchange dominates. | ||
| Pennsylvania | 3.97 | 6.44 | 6.10 | ↑ | While fracking ignites economy, statehouse helps with badly needed tort reform. | ||
| Rhode Island | 2.55 | 5.79 | 5.89 | ↓ | Puts big burdens on business as state struggles to escape fiscal hole. | ||
| South Carolina | 7.02 | 7.04 | 7.79 | ↔ | Is now tackling reform of taxes, worker’s comp and unemployment insurance. | ||
| South Dakota | 8.71 | 7.42 | 6.75 | ↓ | Suffers with middling company-friendliness and sti! competition to north. | ||
| Tennessee | 7.78 | 7.37 | 7.94 | ↔ | Business community awaits substantial unemployment-insurance reform. | ||
| Texas | 8.58 | 8.05 | 7.94 | ↔ | Still a leading jobs magnet, but persistent drought pinches many businesses. | ||
| Utah | 7.95 | 8.73 | 8.43 | ↔ | Ground-breaking health-insurance exchange is big new risk in business-friendly state. | ||
| Vermont | 2.35 | 5.35 | 5.85 | ↔ | Nation’s sole single-payer health-reform law awaits Obamacare decision. | ||
| Virginia | 7.07 | 7.98 | 8.07 | ↑ | Has focused on entrepreneur-friendliness and leveraging higher-ed advantages. | ||
| Washington | 4.34 | 6.68 | 6.70 | ↔ | Lack of income tax strains to hide other financial and regulatory snares for business. | ||
| West Virginia | 5.36 | 5.28 | 5.12 | ↔ | Excitement over business potential of Marcellus Shale isn’t yet realized. | ||
| Wisconsin | 5.56 | 7.48 | 7.27 | ↑ | New conservative statehouse is shaking things up, drawing business favor. | ||
| Wyoming | 8.89 | 7.50 | 7.51 | ↔ | Feather-light tax burden can only get so much done; awaiting more gas drilling. | ||
| STATE GDP2 | UNEMPLOYMENT3 | ||||||
|---|---|---|---|---|---|---|---|
| STATE | % GROWTH 2007-2010 |
% 2007–2010 GROWTH vs. NAT’L AVERAGE (-0.33) |
UNEMPLOYMENT RATE % DEC. 2011 |
COMPARISON WITH NATIONAL UNEMPLOYMENT RATE % (8.50%) |
|||
| Alabama | -1.10% | -0.76% | 8.10 | 0.40 | |||
| Alaska | 10.53% | 10.86% | 7.30 | -1.20 | |||
| Arizona | -6.70% | -6.37% | 8.70 | 0.20 | |||
| Arkansas | 0.69% | 1.03% | 7.70 | -0.80 | |||
| California | -2.08% | -1.74% | 11.10 | 2.60 | |||
| Colorado | 2.84% | 3.17% | 7.90 | -0.60 | |||
| Connecticut | 0.51% | 0.85% | 8.20 | -0.30 | |||
| Delaware | -1.54% | -1.21% | 7.40 | -1.10 | |||
| Florida | -5.70% | -5.36% | 9.90 | 1.40 | |||
| Georgia | -4.42% | -4.08% | 9.70 | 1.20 | |||
| Hawaii | -0.56% | -0.23% | 6.60 | -1.90 | |||
| Idaho | -1.57% | -1.23% | 8.40 | -0.10 | |||
| Illinois | -1.74% | -1.40% | 9.80 | 1.30 | |||
| Indiana | -1.41% | -1.08% | 9.00 | 0.50 | |||
| Iowa | 0.30% | 0.64% | 5.60 | -2.90 | |||
| Kansas | 0.00% | 0.34% | 6.30 | -2.20 | |||
| Kentucky | 1.66% | 1.99% | 9.10 | 0.60 | |||
| Louisiana | 5.29% | 5.62% | 6.80 | -1.70 | |||
| Maine | -0.81% | -0.48% | 7.00 | -1.50 | |||
| Maryland | 3.06% | 3.39% | 6.70 | -1.80 | |||
| Massachusetts | 2.35% | 2.69% | 6.80 | -1.70 | |||
| Michigan | -6.37% | -6.03% | 9.30 | 0.80 | |||
| Minnesota | 1.56% | 1.89% | 5.70 | -2.80 | |||
| Mississippi | 0.06% | 0.39% | 10.40 | 1.90 | |||
| Missouri | -1.05% | -0.72% | 8.00 | -0.50 | |||
| Montana | -1.22% | -0.88% | 6.80 | -1.70 | |||
| Nebraska | 3.39% | 3.73% | 4.10 | -4.40 | |||
| Nevada | -10.04% | -9.70% | 12.60 | 4.10 | |||
| New Hampshire | -0.47% | -0.13% | 5.10 | -3.40 | |||
| New Jersey | -1.33% | -1.00% | 9.00 | 0.50 | |||
| New Mexico | 4.42% | 4.76% | 6.60 | -1.90 | |||
| New York | 1.55% | 1.88% | 8.00 | -0.50 | |||
| North Carolina | 0.12% | 0.46% | 9.90 | 1.40 | |||
| North Dakota | 18.24% | 18.57% | 3.30 | -5.20 | |||
| Ohio | -3.73% | -3.39% | 8.10 | -0.40 | |||
| Oklahoma | 2.87% | 3.20% | 6.10 | -2.40 | |||
| Oregon | 2.44% | 2.78% | 8.90 | 0.40 | |||
| Pennsylvania | 1.44% | 1.77% | 7.60 | -0.90 | |||
| Rhode Island | -1.14% | -0.80% | 10.80 | 2.30 | |||
| South Carolina | -2.18% | -1.84% | 9.50 | 1.00 | |||
| South Dakota | 9.84% | 10.17% | 4.20 | -4.30 | |||
| Tennessee | -0.91% | -0.58% | 8.70 | 0.20 | |||
| Texas | 3.13% | 3.46% | 7.80 | -0.70 | |||
| Utah | 1.10% | 1.43% | 6.00 | -2.50 | |||
| Vermont | 1.17% | 1.50% | 5.10 | -3.40 | |||
| Virginia | 3.70% | 4.04% | 6.20 | -2.3 | |||
| Washington | 0.21% | 0.54% | 8.50 | 0.00 | |||
| West Virginia | 6.90% | 7.23% | 7.90 | -0.60 | |||
| Wisconsin | -1.45% | -1.11% | 7.10 | -1.40 | |||
| Wyoming | 15.44% | 15.77% | 5.80 | -2.70 | |||
| DOMESTIC MIGRATION4 | STATE GOVERNMENT5 | STATE-LOCAL TAX BURDEN6 | ||||
|---|---|---|---|---|---|---|
| STATE | DOMESTIC NET MIGRATION (2000-2009) |
RANK | DEBT PER CAPITA FISCAL YEAR 2010 |
STATE & LOCAL GOV’T EMPLOYEES PER 10,000 RESIDENTS |
RATE | COMPARED TO NATIONAL AVERAGE (9.8%) |
| Alabama | 87,199 | 14 | 1,841 | 615.31 | 8.50% | -1.30% |
| Alaska | -7,630 | 29 | 9,032 | 766.00 | 6.35% | -3.45% |
| Arizona | 696,793 | 3 | 2,188 | 473.07 | 8.67% | -1.13% |
| Arkansas | 75,163 | 16 | 1,464 | 585.28 | 9.87% | 0.07% |
| California | -1,490,105 | 49 | 4,008 | 504.56 | 10.59% | 0.79% |
| Colorado | 202,735 | 10 | 3,335 | 541.89 | 8.59% | -1.21% |
| Connecticut | -94,376 | 41 | 8,465 | 537.40 | 12.03% | 2.23% |
| Delaware | 45,424 | 18 | 6,157 | 598.78 | 9.58% | -0.22% |
| Florida | 1,154,213 | 1 | 2,155 | 489.48 | 9.25% | -0.55% |
| Georgia | 550,369 | 5 | 1,426 | 545.70 | 9.12% | -0.68% |
| Hawaii | -29,022 | 33 | 5,682 | 559.77 | 9.62% | -0.18% |
| Idaho | 110,279 | 13 | 2,478 | 538.62 | 9.37% | -0.43% |
| Illinois | -614,616 | 48 | 4,790 | 503.13 | 9.97% | 0.17% |
| Indiana | -21,467 | 32 | 3,650 | 536.29 | 9.49% | -0.31% |
| Iowa | -49,589 | 39 | 1,690 | 611.24 | 9.53% | -0.27% |
| Kansas | -67,762 | 40 | 2,276 | 676.73 | 9.71% | -0.09% |
| Kentucky | 81,711 | 15 | 3,323 | 582.67 | 9.28% | -0.52% |
| Louisiana | -311,368 | 44 | 3,861 | 605.08 | 8.18% | -1.62% |
| Maine | 29,260 | 23 | 4,542 | 580.68 | 10.13% | 0.33% |
| Maryland | -95,775 | 42 | 4,250 | 535.20 | 10.01% | 0.21% |
| Massachussets | -274,772 | 43 | 11,310 | 517.50 | 10.02% | 0.22% |
| Michigan | -537,471 | 47 | 3,251 | 491.02 | 9.67% | -0.13% |
| Minnesota | -46,635 | 38 | 2,206 | 541.81 | 10.29% | 0.49% |
| Mississippi | -36,061 | 35 | 2,182 | 647.68 | 8.73% | -1.07% |
| Missouri | 41,278 | 20 | 3,416 | 557.33 | 9.05% | -0.75% |
| Montana | 39,853 | 21 | 4,430 | 585.20 | 8.74% | -1.06% |
| Nebraska | -39,275 | 36 | 1,279 | 642.00 | 9.81% | 0.01% |
| Nevada | 361,512 | 6 | 1,646 | 431.88 | 7.48% | -2.32% |
| New Hampshire | 32,588 | 22 | 6,341 | 550.01 | 8.04% | -1.76% |
| New Jersey | -451,407 | 46 | 6,944 | 592.98 | 12.21% | 2.41% |
| New Mexico | 26,383 | 24 | 4,261 | 680.41 | 8.38% | -1.42% |
| New York | -1,649,644 | 50 | 6,694 | 634.48 | 12.06% | 2.26% |
| North Carolina | 663,892 | 4 | 1,983 | 599.65 | 9.78% | -0.02% |
| North Dakota | -18,071 | 31 | 3,282 | 649.49 | 9.47% | -0.33% |
| Ohio | -361,038 | 45 | 2,703 | 534.59 | 9.71% | -0.09% |
| Oklahoma | 42,284 | 19 | 2,664 | 597.88 | 8.70% | -1.10% |
| Oregon | 177,375 | 11 | 3,533 | 509.15 | 9.76% | -0.04% |
| Pennsylvania | -33,119 | 34 | 3,526 | 478.44 | 10.05% | 0.25% |
| Rhode Island | -45,159 | 37 | 9,018 | 510.84 | 10.72% | 0.92% |
| South Carolina | 306,045 | 7 | 3,419 | 577.25 | 8.07% | -1.73% |
| South Dakota | 7,182 | 27 | 4,291 | 545.70 | 7.59% | -2.21% |
| Tennessee | 259,711 | 8 | 922 | 527.75 | 7.61% | -2.19% |
| Texas | 838,126 | 2 | 1,679 | 563.86 | 7.89% | -1.91% |
| Utah | 53,390 | 17 | 2,356 | 494.85 | 9.68% | -0.12% |
| Vermont | -1,505 | 28 | 5,585 | 641.03 | 10.18% | 0.38% |
| Virginia | 164,930 | 12 | 3,131 | 574.02 | 9.11% | -0.69% |
| Washington | 239,037 | 9 | 4,098 | 527.25 | 9.31 | -0.49% |
| West Virginia | 17,727 | 26 | 3,860 | 558.46 | 9.39% | -0.41% |
| Wisconsin | -11,981 | 30 | 3,929 | 503.04 | 10.98% | 1.18% |
| Wyoming | 22,883 | 25 | 2,694 | 918.30 | 7.80% | -2.00% |
Sources: Sources: 1Chief Executive Magazine, 2Bureau of Economic Analysis, 3Bureau of Labor Statistics, 4NewGeography.com, 5,6The Tax Foundation