Now in its third year, the CEO wealth creation index developed by Chief Executive magazine, Applied Finance Group and Great Numbers! attempts to identify those business leaders who have performed best in creating true economic value—as opposed to mere accounting value—as measured by GAAP metrics. Creating value is, after all, why CEOs do what they do. The WCI leans heavily on the concept of economic margin (EM). (EM measures the degree to which a company makes money in excess of its risk-adjusted cost of capital.) While there is no single metric that is perfect, EM comes close, in that it isn’t dependent on share price in assessing management’s impact on value creation. (The rankings do not include REITs among the S&P 500 and only assess companies whose CEO has been in the job for at least three years in order to get a fair appraisal of CEO actions under varying conditions. For more details on methodology, see Ranking CEO Wealth Creation.)
The past 12 months have not been an easy time to grow—or for companies with high levels of EM to maintain them. The more profitable a company is, the more difficult it is to maintain high levels of profitability when competitors step up and target market leaders. Some companies find that the “easy money”—high margins on a product or market—ultimately dries up. Also, if a business model is successful and a company is making healthy profits, it becomes a target.
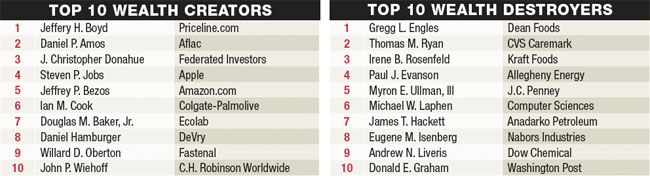
Similarly, the regulatory environment can make it difficult for companies to maneuver. Both financial and healthcare companies have become the worst-performing sectors over the last 12 months. Even the well-managed ones struggle with maintaining past success. For example, Master- Card, which led the rankings last year, couldn’t maintain its change in EM momentum and slipped to No. 24, still a respectable score. Federated Investors, however, has consistently stayed in the top three since the WCI’s inception.
In entering the S&P 500 this year, Priceline.com vaulted to the top of this year’s rankings. The company’s EM had been dragged down in earlier years, but was consistently high in more recent years. It has also had tremendous success in moving its U.S. business model to international markets, with non-U.S. revenue doubling last year to top U.S. revenue. In addition, Priceline kept its operating costs in check, limiting them to 20 percent of year-on-year growth while pursuing an industry-leading growth in revenues of 27 percent. This allowed the firm to take market share from Expedia, another high scorer. Because the company offers a commodity product in a cutthroat industry marked by extreme ease of entry, it’s difficult to assess whether Priceline can maintain its high-wire act. CEO Jeffrey Boyd says, “The most important metric we use is gross bookings growth, which refers to the overall value of all the travel products we sell. The Internet and online travel are still in their infancy in many parts of the world. As a global business, our focus is on increasing overall sales and building our market share. We also look to maintain or improve our net operating margins so we can grow profitably. When interim results don’t match expectations, our management team evaluates whether it is a supply, marketing or cost issue and makes adjustments accordingly.”
 |
 |
As the online travel market grows more saturated it will be more difficult to differentiate. But Priceline enjoys a healthy balance sheet and has slightly less cash than debt, so it gets high marks for managing growth and profitability.
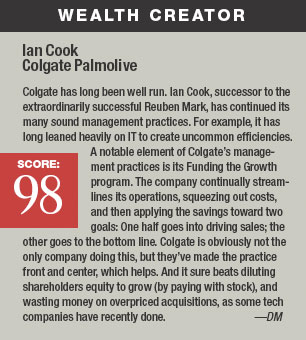
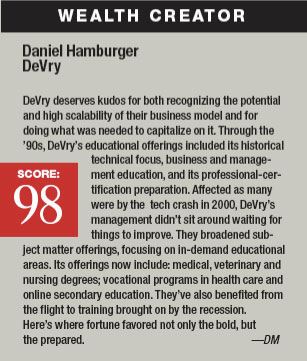
Other stellar wealth creators include Jeffrey Bezos of Amazon and Douglas Baker of Ecolab, both of whom return to the top 10 from last year, showing that strong execution skills translate into wealth-creating staying power. Daniel Amos of Aflac, Steve Jobs of Apple, Ian Cook of Colgate-Palmolive, John Wiehoff of C.H. Robinson Worldwide and Daniel Hambuger of DeVry return in 2010 among the high scorers. David Yost of Amerisource Bergen, Theodore Solso of Cummins, Gregory Johnson of Franklin Resources, Mark Templeton of Citrix Systems, Chris Begley of Hospira and James Rohr of PNC Financial were among the leaders who advanced at least 100 positions in ranks since 2009.
Less stellar performances were logged by Windstream’s Jeffrey Gardner, ConAgra’s Gary Rodkin and FirstEnergy’s Anthony Alexander, who are all among those who dropped more than 100 places since last year.
 |
 |
Ranking CEO Wealth Creation
The ranking focuses on the performance of companies (and their CEOs) in the S&P 500 index for the three years that ended on June 30, 2010. It’s based on reported results during that period and estimates for the next 12 months.
CEOs whose tenure did not cover the full three years were not ranked. Also not ranked are the 14 REITs in the 2010 S&P 500 and the companies for which a full three years of financial results were not available.
The four components of the ranking, explained below, were developed and calculated by the Applied Finance Group (AFG), an independent equity research advisory firm using proprietary metrics and data. A weighted combination of each company’s component rankings is used to produce an overall score: 100 is awarded to the best wealth creator; 1 to the worst. (The list itself casts these scores as a sequential ranking.) The component rankings are shown as letter grades with companies in the top 20 percent of each sector receiving an A; the bottom 20 percent receiving an F.
 |
 |
Market (or Enterprise) Value/Invested Capital (MV/IC)
This measure shows the degree to which investors value the company’s assets, relative to their cost. Market value is what a buyer would have to pay to buy the company outright; that is, to purchase all the stock and pay off all the loans, leases and other obligations. Note that market value depends on the stock price. Invested capital is the inflation-adjusted total of all of the investments in the business. It does not depend on the stock price. So by its nature, MV/IC reflects the market’s take on the value of the investments made in the business.
The Average of the Past Three Years’ Economic Margins
Economic margin (EM) measures the degree to which the company is making money in excess of its risk-adjusted capital cost. It’s expressed as a percentage of invested capital. EM is calculated as (operating cash flow – capital charge)/invested capital. Companies with positive EM (greater than 0 percent) are creating wealth; those with negative EM are destroying it.
EM Change
This is a 12-month forecast, based on the ratio of the most recent EM to the three-year average.
Management Quality
This AFG-proprietary measure rewards a company with positive EM for increasing its asset base, and penalizes one with negative EM for growing its asset base. In other words, if a company is making money and it adds assets in such a way that it can make even more, that’s good. So is selling off a money-losing division. That said, it’s also valid that adding scale can dramatically increase profitability in a business with high fixed costs.
A Validity Check on the Ranking Method
The top 50 companies in the ranking delivered an average total shareholder return (TSR) of 73.3 percent between January 2007 and June 2010 (the period covered in the reported financials). The bottom 50 companies’ TSR averaged -3.4 percent, while the S&P 500’s average was 14.9 percent (without its 14 REITs). The top 50’s median TSR was 33 percent; the bottom 50’s was 9.5 percent.
As the table above shows, the top 50 companies in the wealth-creation ranking far outperformed the bottom 50 companies and the S&P 500. Note: Total shareholder return equals share-price return plus reinvested dividends.
How to Move Up in the Rankings
In publishing this list, Chief Executive aims to show CEOs both where they stand with respect to their peers (awareness being the mother of improvement) and to make clear how to go about improving one’s standing. Improvement will require several actions that the company’s CEO, division heads and general managers can take:
At the corporate level:
- Use EM to measure wealth creation throughout the company.
- Manage your portfolio of businesses from a wealth-creation perspective. This includes opportunity sensing—entering lucrative or fast-growing businesses, as well as putting businesses making sub-par contributions into other hands or shuttering them. Set the contribution hurdle rate to maximize economic-value creation.
- Ensure that the company’s capital structure is right. This affects the capital charge and invested capital. Equity is more expensive than debt, but too much debt can kill a company.
- Avoid overpaying for acquisitions or buying back stock at its peaks.
At the business unit level:
The general managers of businesses need to find the best things they can do to boost operating results. (See “Leading Your Business to Maximum Results” (CE Jan/Feb 2008).
At all levels:
Get all you can out of your assets. Example: large software companies (IBM, Oracle and others) have been acquiring other software firms so that their sales forces, which are major leverageable assets, have more offerings to sell to customers. Include all of your intangible assets, not just intellectual property, in your thinking. Work hard to create and improve customers’ feelings about your company and its offerings, the promises your brands represent, your value propositions, etc. (For more, see “The Economic Stimulus Package Inside Every Business,” CE Online Jan/Feb 2009, and “Do Intangibles Matter?“, CE July/August 2008).
Finally, manage internal and external risks across the company and its aggregate risk-reward profile by taking a wide-angle lens to what could happen.
Drew Morris (drew.morris@greatnumbers.com) is the founder and CEO of Great Numbers!, which helps executives find, and deliver on, the untapped upside in their businesses. He has no stake in any of the companies mentioned. Michael Burdi (www.economicmargin.com) is senior analyst for Applied Finance Group, Ltd., a Chicago-based independent equity research advisory firm specializing in performance and valuation measurement using EM. Chris Austin, senior portfolio consultant at AFG, also contributed to this article.