
As early as 2018, U.S. employers have been competing for top talent during one of the most significant labor shortages in recent history. This labor shortage has been compounded by ongoing Covid-19 pandemic impacts, changes in employee preferences for hybrid versus in-person work, an aging workforce and a shortage of qualified workers with key skillsets to fill vacancies. Yet recent trends may indicate that a cooling period for the U.S. labor market is approaching. January’s Job Openings and Labor Turnover Survey (JOLTS), released by the U.S. Bureau of Labor Statistics in early March, indicates that job openings are falling, layoffs are increasing and quits are dropping.
These trends have been front and center in big tech, where more than 1,500 tech firms have executed nearly 300,000 layoffs across corporate and technical functions in the last two years. Large-scale layoffs have not been restricted to big tech employers—in the last six months, companies in automotive, consumer and industrial products; financial services; life sciences sectors and more have announced intentions to reduce headcount across corporate and technical job roles. Even with these emerging signs of a cooling labor market, we are far from the days when employers enjoyed an abundance of talent across functions and workers outnumbered job vacancies. U.S. job openings are still at more than 10 million strong as of January 2023, nearly double the number of unemployed people looking for work. Even if the labor market cools moderately from its current state, employers will still need to continue to compete for key talent.
So, what can CEOs do to improve their talent share under these difficult circumstances? First and foremost, it is imperative to recognize that not every region is experiencing the same labor conditions for every job role. Labor conditions and costs associated with specific job functions vary widely across the U.S., and locations that may present favorable conditions for attracting and retaining software engineers may be less suitable for manufacturing technicians, financial analysts or other functions. Employers should let their talent needs drive their geographic footprint, rather than shackling themselves to existing locations or available office space that the company may be keen to fill.
In the accompanying charts, we have evaluated labor costs and labor availability for software engineers, financial analysts and manufacturing technicians across six U.S. metros. The performance of each city in terms of labor costs and talent availability varies by job category.


SUMMARY RESULTS
Austin, TX: Austin has enjoyed years of investment from big tech firms and other high-profile companies moving operations to the area. While the region may have opportunities for labor cost savings over more established hubs such as Seattle (40 percent cost savings for software developers) and New York (50 percent cost savings for financial analyst roles), Austin’s growing yet relatively limited labor pool is struggling to keep up with demands from employers across multiple functions. Recent mega-project announcements are also putting pressure on Austin’s manufacturing talent; the less than 700 technicians in the market can command a nearly 10 percent premium in labor costs over the national average.
Dallas, TX: Dallas is one of the fastest-growing labor markets in the U.S. and has drawn cross-functional talent attracted to the area’s relatively affordable cost of living and a large presence of well-known company headquarters, business centers and other operations with employment opportunities. Dallas presents strong conditions for corporate-leaning functions, including financial analysts, where the market performs on-par with New York but at 50 percent of the labor costs.
Denver, CO: Despite its strong population growth over the last few years, Denver’s labor market tends to have weaker performance indicators and relatively high costs for the evaluated job roles. It has a comparatively small pool of talent in each role, characterized by a high level of competition among employers. Companies deploying a manufacturing facility in particular may want to think twice about Denver as a location option: with less than 400 manufacturing technicians and a decline of 3.3 percent in employment for this role over the last three years, this type of skillset is comparatively scarce in the market.
New York, NY: As a long-established hub for financial institutions, business services and other major industries, New York is typically among the highest-cost locations for most job functions in the U.S., especially for corporate roles. Companies hiring financial analysts may find strong pools of relevant talent in New York, but can capitalize on similarly high-performing labor markets for these roles at a fraction of New York’s costs. While New York has some 2,000 manufacturing technicians in the labor market, this population has declined by more than 8 percent over the last three years, creating weaker labor market conditions for this job role.
Phoenix, AZ: While Phoenix has enjoyed decades of investment in office and manufacturing operations across industries, competition for talent has reached extreme levels, with unemployment rates for software developers and financial analysts at less than 1.0 percent. Compared to other locations, Phoenix has a lower labor supply, slower employment growth and a location quotient on par with the U.S. average in these two job functions, creating challenging conditions for attracting talent despite relatively competitive labor costs. Where Phoenix shines is in manufacturing talent—it is one of the few evaluated markets with a growing manufacturing technician workforce and a strong concentration in relevant skillsets.
Seattle, WA: Like New York, Seattle tends to be among the higher-cost markets in the U.S. for the evaluated job functions, particularly for tech talent and manufacturing technicians. As a well-established hub for software developers with major big tech employers in the market, Seattle demonstrates highly favorable labor market conditions for this job function, but at a significant cost premium compared to the U.S. average. With the recent tech layoffs, Seattle labor costs for software developers may not increase as much over the next few years, but are unlikely to become competitive with labor costs in Austin, Dallas or Denver anytime soon.
Every company has a unique story as to how it came to establish its footprint of operations, many having grown either organically or through acquisition. However, labor markets that historically made sense for certain aspects of the business may now present significant challenges for talent recruitment and retention or may be too expensive to sustain the required operations. Before scaling up or winding down in any labor market, CEOs need to direct their teams to evaluate existing and new location opportunities based on the specific talent requirements of the business and a holistic view of cost and non-cost factors.
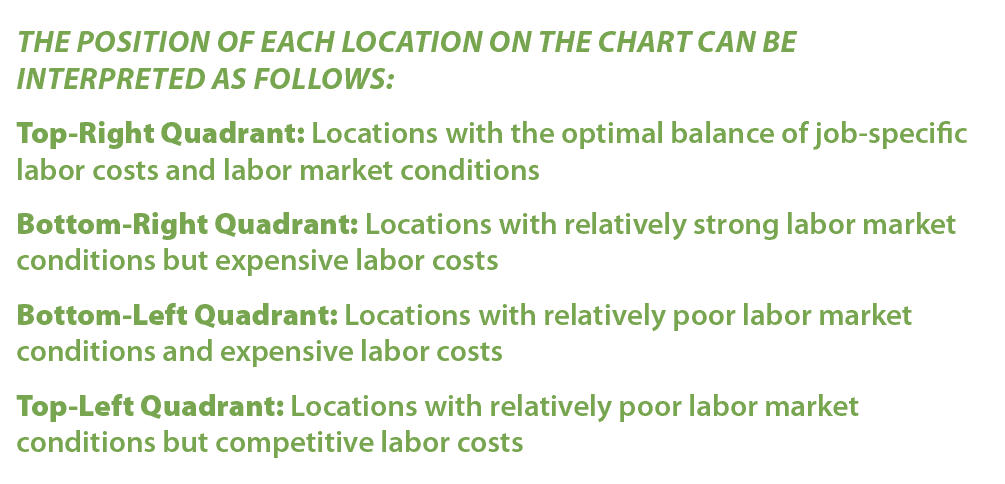
Note: Methodology and chart Interpretation: Each chart showcases the relative labor market conditions and labor costs across six U.S. metro areas that are specific to the indicated job function. Labor availability (x-axis) is comprised of the following non-cost factors: employment level, three-year change in employment level, location quotient (occupation concentration), and unemployment rate for each specific function. Each factor is scored on a scale from 1–5, with five being the best-performing location and one being the worst-performing location. Labor costs (y-axis) are the average annual base salaries for the specified job function in each location, indexed to the U.S. average (U.S. = 1.00). Locations with index values greater than 1.00 have higher costs than the U.S. average for the specified occupation, while an index value lower than 1.00 indicates lower costs than the U.S. average for the specified occupation. Labor market and cost data were obtained from the U.S. Bureau of Labor Statistics via JobsEQ, data as of 2022 Q3.