For this year’s wealth-creation ranking (see p. 40), we’ve adopted a methodology recommended by Bennett Stewart, CEO of EVA Dimensions. CEO performance was assessed using four measures based on the concept of economic value added (EVA). EVA is the profit remaining after subtracting the full cost of capital for the business—known as economic profit.
The first measure, EVA Momentum, shows the trend in the growth of the firm’s EVA profits over the past three years. It is better at measuring wealth-creation over time than growth in sales, EBIT, EBITDA or earnings per share, since it only counts profit growth after covering the full cost of capital, including a minimum shareholder return to compensate for risk.
The second measure, EVA Margin, shows how profitable the firm is per dollar of sales. Its value combines pricing power, operating efficiency and how well assets were managed into a single net margin score.
The third measure, market-implied momentum (MIM), measures the expected long-run growth rate for economic profits that are reflected in the company’s stock price. It shows how well the CEO has positioned the company for continued profitable expansion—through initiatives targeting growth markets, innovations, brand value and operations excellence—as far as investors can tell.
The final measure, MVA margin, is a wealth-creation index. MVA, or market value added, is the difference between a firm’s market value and the capital it has invested in business assets expressed as a percent of sales. The higher it is, the better—there’s more shareholder wealth—and a greater franchise value stemming from the business.
All of the measures were computed for each company using June 30, 2014 share prices and the most recently reported financial data up to, but not after, June 30, 2014. The measures were then ranked within their industry groups to arrive at percentile scores. A company’s final score is a weighted combination of the four percentile scores. The best-performing companies in each industry rise to the top, and those at the very top consistently outperform their industry peers across all four measurement categories. They exhibit outstanding profitability, an exceptional rate of profitable growth, a premium stock price and justification for continued confidence in their future success.
Please note that because we changed the scoring methodology this year, last year’s scores, shown for comparison, were recalculated using the new methodology described above.
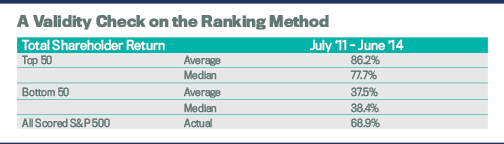
The top-50 companies in the ranking delivered an average total shareholder return (TSR) of 86.2 percent between July 2011 and June 2014 (the period covered in the reported financials). The bottom-50 companies’ TSR averaged 37.5 percent, while the actual TSR for all of the scored S&P 500 companies was 68.9 percent. The top-50’s median TSR was 77.7 percent; the bottom-50’s was 38.4 percent.
As the table at bottom shows, the top-50 companies in the wealth-creation ranking far outperformed the bottom-50 companies and the scored S&P 500 between July 2011 and June 2014. [Note: Total Shareholder Return = share-price return percent plus reinvested dividends, expressed as a percent.]