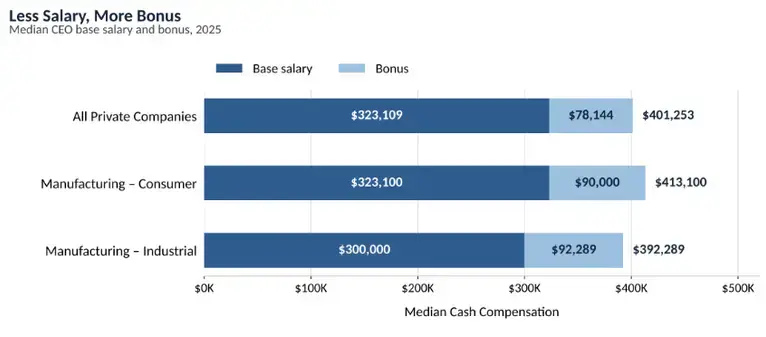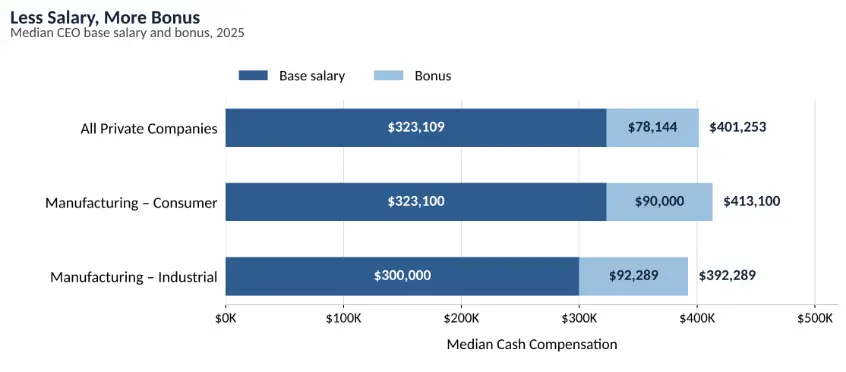
According to Chief Executive Group’s annual CEO and Senior Executive Compensation Report, the total compensation package paid out for the median consumer manufacturing CEO was $451,705 last year and for the median industrial manufacturing CEO it was $428,673. The median across all private companies was $438,203, which sits in between both sectors. Those numbers are for the whole package, but when you look at strictly cash compensation, including base salary and bonus, the figures are $413,100 for consumer manufacturers and $392,289 for those in industrial manufacturing, against an all-company median of $401,253.
The split between salary and bonus is where manufacturers differ from their peers in other sectors.
To break it down further, a private-company CEO took a median base salary of $323,109 and a bonus of $78,144 in 2025. Consumer manufacturing companies reported a very similar median base salary of $323,100 for their CEOs and paid a bonus of $90,000. Industrial manufacturing paid a base of $300,000, and the largest bonus of the three at $92,289.
Jim Nelson, who runs 127-year-old industrial and chemical instruments manufacturer, Parr Instruments, is blunt about the trade. “Our base salary is probably not as high as some companies because our [bonus structure] can be pretty lucrative.”
Nelson’s company runs two bonus programs: “One bonus that goes out the entire employee base. So even in an hourly shop worker who gets paid overtime gets a bonus on their overtime as well.” The second is funded from profit: “We take a certain percentage of our operating profit, put it in a bonus pool, and for top executives, it can be more than your salary.”
The design is deliberate. “We try to weigh more of our compensation on that bonus structure because we want to be able to pay that in good years, but if it’s a bad year, then everybody, a rising tide floats all boats if we’re doing our job.”
Bob Grote, whose family has run an industrial food processing manufacturing company for 55 years, says the number his workforce actually tracks is the one that feeds the bonus pool. “At the end of the day, we pay bonuses based on profit. So that’s what they really care about. When during a town hall meeting, that’s what they’re asking me. It’s like, so how are we on pace? Are we on pace for budget? Are we going to make money?”
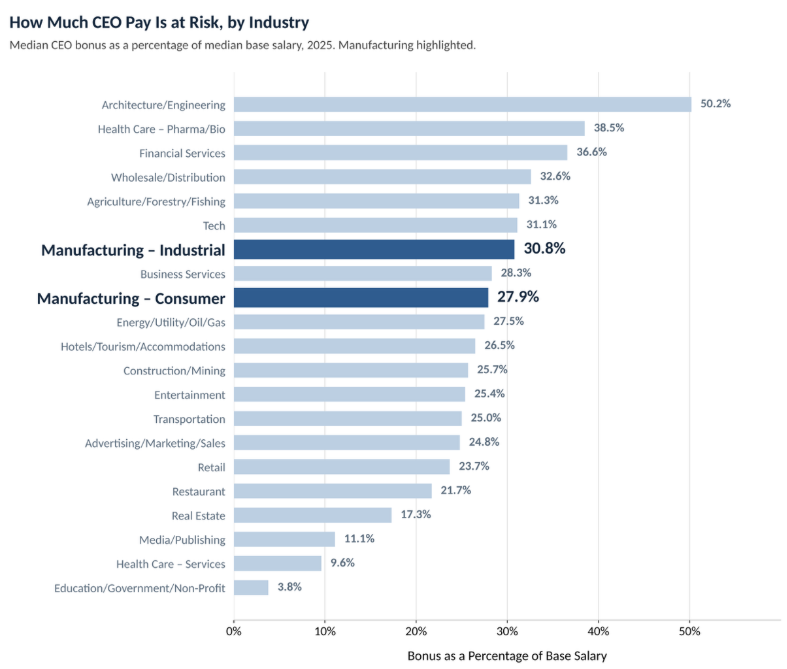
Across the 21 industries in the survey, manufacturing bonuses rank seventh and ninth as a share of base salary: 30.8 percent in industrial, 27.9 percent in consumer. Both metrics sit above the middle of the field.
Beyond Cash Compensation
Ask manufacturing CEOs about perks and the answer is consistent.
“Our philosophy has been pretty no frills,” Nelson said. “We don’t pay for cell phones, we don’t pay for cars.” The reasoning follows from the bonus design: “Because there’s so much incentive wrapped around profitability, the goal is really that operating profit, how high can we get that, because then we’re all rewarded.”
Pete Ensch, who runs a private equity-backed Wisconsin manufacturer, Sani-Matic, said much the same. “We don’t have a ton of perks.” Sales staff get car allowances and heavy travelers get some support, but little else. “Equity-backed companies don’t really have a lot of that. They like to have everything kind of captured in kind of classic buckets.”
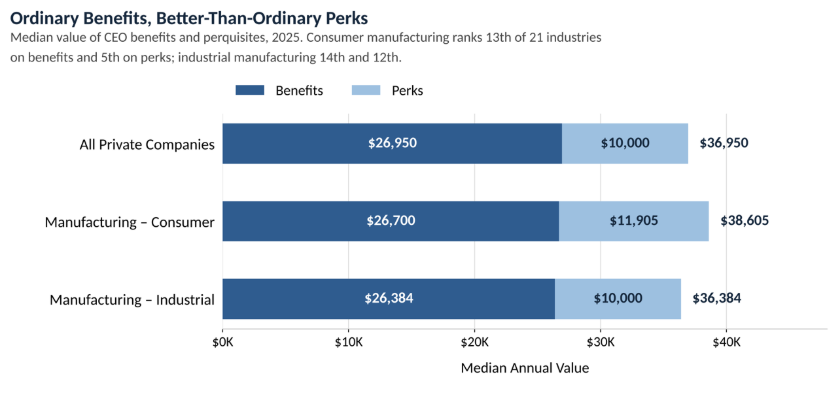
On benefits, manufacturing is slightly below the market. The median value of CEO benefits across all private companies was $26,950. Consumer manufacturing came in at $26,700 and industrial at $26,384, 13th and 14th of 21 industries. That is below the median benefits packages offered at companies in financial services, entertainment and agriculture, but still above the median for tech companies.
On perks, consumer manufacturing is near the top of the market and industrial manufacturing matches the median. And research shows that manufacturing companies can approach the non-cash components of compensation in differing ways depending on ownership type and general compensation philosophy.
For instance, Al Murphy, CEO of Mother Murphy’s, one of the largest flavor manufacturers in the South, pays 90 percent of employee healthcare, keeps a nurse on staff, brings in financial advisers and enrollment counselors, and covers part of the cost when employees go back to school, including continuing education for executives. This year he even added executive physicals at the Cooper Clinic. “It’s probably like a $7,000 per person benefit to where they do a full health scan.” He says, “If you don’t have good health, what are you going to do? You don’t have really anything,” explaining how he approaches benefits and perks from a different philosophy.
Only 17.3 percent of private-company CEOs get an annual physical as a benefit. Murphy’s executives now do.
He also has a common problem: Nobody can see what any of it is worth. So, his team started issuing one-page statements. “You might be a $60,000 or $70,000 employee, but you’re really at $100,000 plus based on what this compensation program is offering and profit share and health insurance.”
So the no-frills reputation holds for industrial manufacturing and overstates the case for consumer. It is worth noting what the published numbers count. Nationally, 95.7 percent of CEOs receive health insurance, 85 percent life insurance and 82.2 percent a defined contribution plan. Those are the bulk of the benefits figure. The things CEOs think of as perks are rarer: a company car or allowance reaches 42 percent, parking 28.2 percent, a gym membership 15.8 percent and a club membership 12.8 percent. Personal technology, at 86.1 percent, is the only near-universal perk.
Nelson’s company is an outlier in a way that doesn’t appear in the perk column at all. “One thing that is very unusual, especially this day and age, and for a company our size, we still have a defined benefit or pension plan.” Only 13.1 percent of private-company CEOs have one. His company also matches 7.75 percent on the 401(k) if the employee contributes at least 4 percent.
The Equity Part
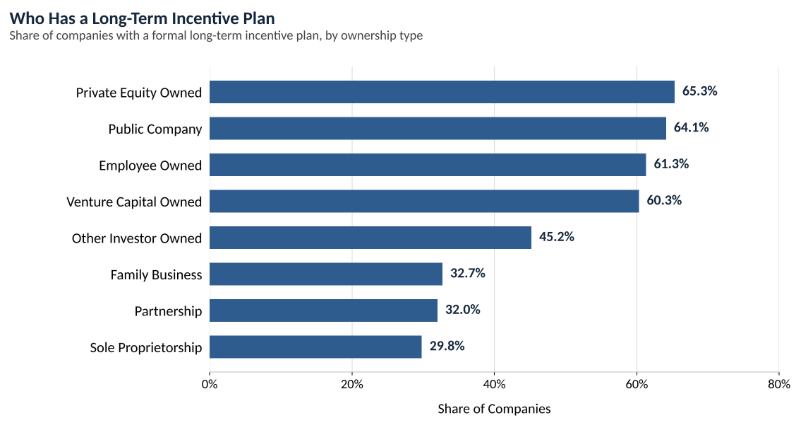
Formal long-term incentive plans sit at 65.3 percent of private equity-owned companies and 32.7 percent of family businesses. Size matters as much as ownership: 27.3 percent of companies under $2 million in revenue have a plan, against 77 percent of those above $1 billion.
Ensch’s company has a structured long-term incentive plan for employees that has grown with him at the helm. “When I got here, we had 26 people who had equity in the business… we have 42 people who have equity in the business now.” That is deliberate: “There’s a lot of engineering talent that [we] want to keep,” explaining how the company strategically uses long-term incentives through offering stake in the business. The effect, he said, is cultural. “You see a mindset change when people are owners, they act differently.”
Nelson’s employee stock purchase program, funded by discounted share purchases with company financing, serves a similar end. “It is designed to retain. We call them our golden handcuffs.”
Murphy’s is narrower and tied to tenure. Employees become eligible after five years, and fewer than 2 percent of his workforce holds stock, but what his people get is access to a rich benefits and perks program rather than equity incentives.
For family manufacturers without an LTI plan, the pressure comes from the hiring market. Grote’s company has started offering non-voting shares after years of relying on stock appreciation rights. “For me to compete for top talent, I have to be able to offer [a long-term equity incentive program] as well,” he said. “We hired a CFO, we hired a vice president of sales. To hire at that level, you have to offer [long-term equity incentives] or they’re not even going to talk to you.”
The compensation median figure tells you what a manufacturing CEO is paid, but it tells you very little about how. Across manufacturing, the cash component tends to be a standard part of executive compensation, largely dependent on company revenue, while equity, benefits and perks are largely about compensation philosophy. What ties executives to the long-term health of the company? Do executives value their benefits and perks? What happens to the package in a bad year? These decisions are driven not only by competition for talent, but also the overall goals of the company.
For more benchmarks by company size, industry and ownership structure, explore Chief Executive Group Research’s latest CEO & Senior Executive Compensation Report.