Based on CEO Survey by ChiefExecutive.net
| Key Metrics |
|---|
State GDP
Unemployment
Domestic Migration
State Government
State-Local Tax Burden
|
| Key Companies |
|---|
|
| Development Trend Indicator: Negative |
|---|
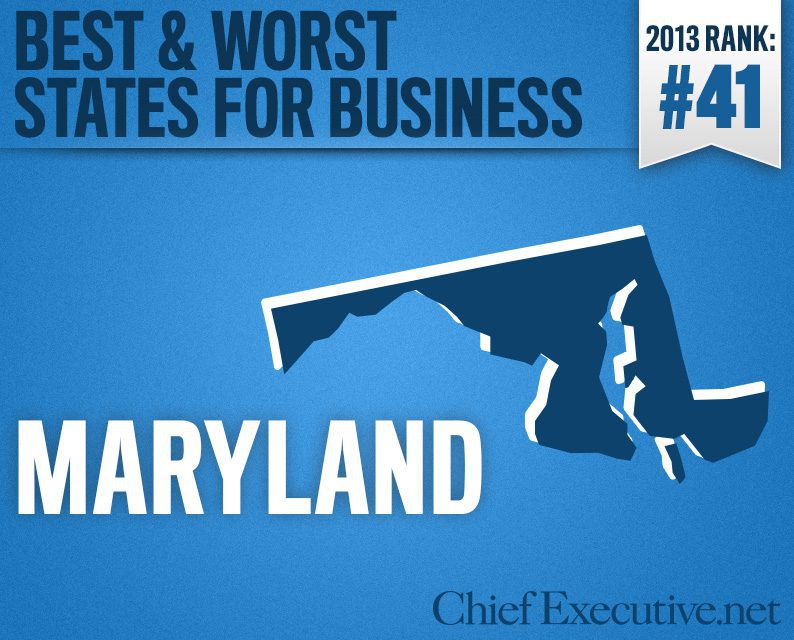
| Passed major tax increases, now may boost minimum wage and sick leave. |
| CEO Comments |
|---|
| “Maryland has a tremendous amount of funding opportunities, business support systems, and a talented and skilled workforce. I believe that it is one of the best states for small businesses in particular.”
“California and Maryland have a ton to do to improve relations with Business. They are driving businesses out of their states” |
Sources:
Bureau of Economic Analysis
Bureau of Labor Statistics
NewGeography.com
The Tax Foundation
Based on CEO Survey by ChiefExecutive.net
| Key Metrics |
|---|
State GDP
Unemployment
Domestic Migration
State Government
State-Local Tax Burden
|
| Key Companies |
|---|
|
| Development Trend Indicator: Positive |
|---|
| Gov. Corbett has resisted tax hikes and instituted some regulatory reforms. |
| CEO Comments |
|---|
| “We are headquartered in Pennsylvania (over 120 years)and have facilities in Florida, Texas, Utah, and Alabama. Pennsylvania is by far the highest taxed for corporations but our workforse and those available to do work (welders, fitters, etc.) is the highest skilled. We also have an excellent group of colleges and universities in our area to supply us with engineers and other college degreed employees. All of the states we are in except Pennsylvania are “right to work” states and we are a non union shop.”
“Pennsylvania Environmental regulations and their bureaucracy make it difficult to plan and build new projects in a timely manner. Indiana is getting more competitive every year and it is boosting the competitiveness of the surrounding states (except for Illinois)” |
Sources:
Bureau of Economic Analysis
Bureau of Labor Statistics
NewGeography.com
The Tax Foundation
Based on CEO Survey by ChiefExecutive.net
| Key Metrics |
|---|
State GDP
Unemployment
Domestic Migration
State Government
State-Local Tax Burden
|
| Key Companies |
|---|
|
| Development Trend Indicator: Neutral |
|---|
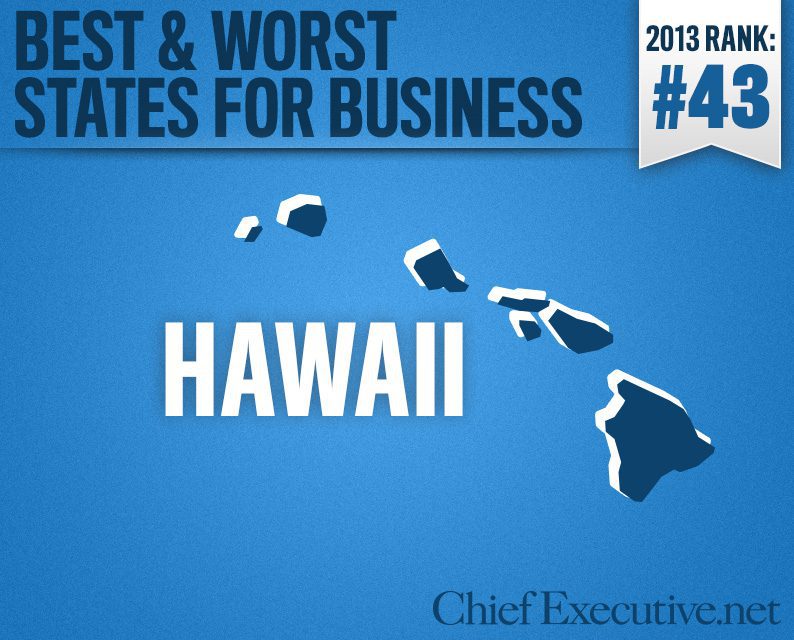
| Court struck down costly sick-leave law but replacement measure is unclear. |
| CEO Comments |
|---|
| “California and Hawaii are very overtaxed and have a political environment that is only making it worse. Business is very difficult in both states and increasing regulations making it nearly impossible yet they always demand more taxes.” |
Sources:
Bureau of Economic Analysis
Bureau of Labor Statistics
NewGeography.com
The Tax Foundation
Based on CEO Survey by ChiefExecutive.net
| Key Metrics |
|---|
State GDP
Unemployment
Domestic Migration
State Government
State-Local Tax Burden
|
| Key Companies |
|---|
|
| Development Trend Indicator: Positive |
|---|
| Leap to right-to-work follows business-tax overhaul, with more reforms likely. |
| CEO Comments |
|---|
| “Michigan is on its way back to fiscal solvency. Our companies are prepared to report profits that have exceeded our original expectations.”
“Michigan’s problem has been poor government and domination by the auto workers union.” |
Sources:
Bureau of Economic Analysis
Bureau of Labor Statistics
NewGeography.com
The Tax Foundation
Based on CEO Survey by ChiefExecutive.net
| Key Metrics |
|---|
State GDP
Unemployment
Domestic Migration
State Government
State-Local Tax Burden
|
| Key Companies |
|---|
|
| Development Trend Indicator: Neutral |
|---|
| Trying to hold line on taxes and spending but solid-blue state lacks growth. |
| CEO Comments |
|---|
| “Connecticut is the worst. Poor leadership.”
“Lower taxes and realistic regulations that don’t send businesses elsewhere. Connecticut is at the bottom of the list.” |
Sources:
Bureau of Economic Analysis
Bureau of Labor Statistics
NewGeography.com
The Tax Foundation
Based on CEO Survey by ChiefExecutive.net
| Key Metrics |
|---|
State GDP
Unemployment
Domestic Migration
State Government
State-Local Tax Burden
|
| Key Companies |
|---|
|
| Development Trend Indicator: Positive |
|---|
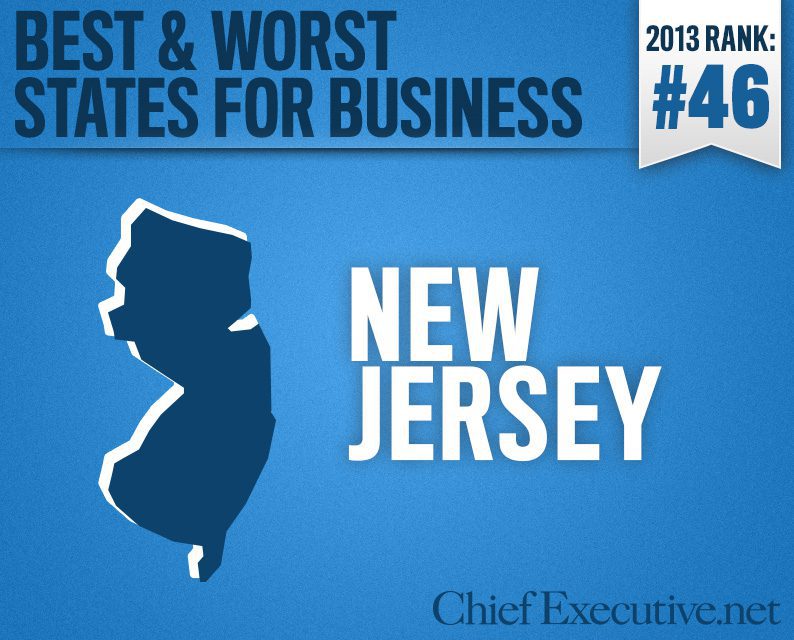
| At least now the debate is over which tax to cut rather than to cut or raise taxes. |
| CEO Comments |
|---|
| “New Jersey is more proactive for business opportunities.” |
Sources:
Bureau of Economic Analysis
Bureau of Labor Statistics
NewGeography.com
The Tax Foundation
Based on CEO Survey by ChiefExecutive.net
| Key Metrics |
|---|
State GDP
Unemployment
Domestic Migration
State Government
State-Local Tax Burden
|
| Key Companies |
|---|
|
| Development Trend Indicator: Negative |
|---|
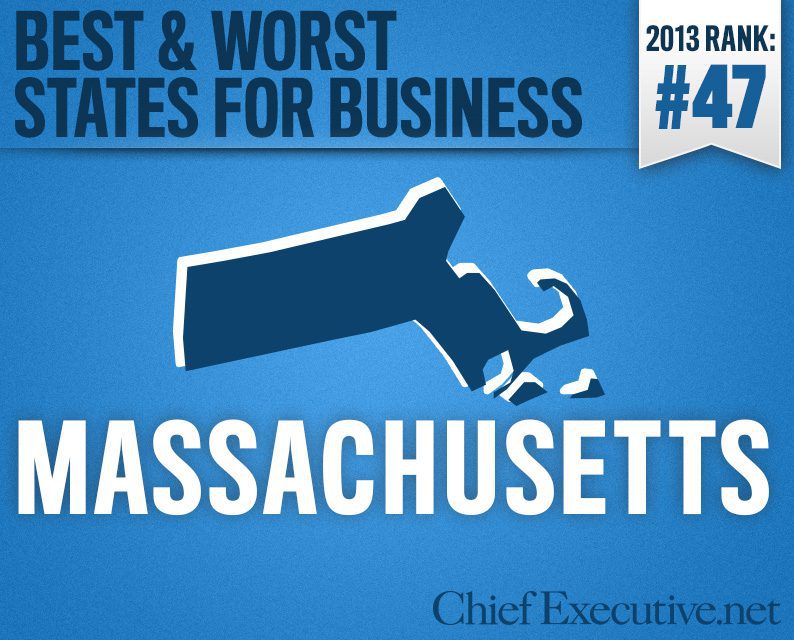
| Appears ready to boost income taxes and add services to sales tax. |
| CEO Comments |
|---|
| “Massachusetts is returning to the state of Taxachusetts, thanks to Governor Deval Patrick and the overwhelming Democratic party majority in both houses of the Legislature.”
“Taxation and regulation are always the key barometers. Massachusetts and Oregon are the worst.” |
Sources:
Bureau of Economic Analysis
Bureau of Labor Statistics
NewGeography.com
The Tax Foundation
Based on CEO Survey by ChiefExecutive.net
| Key Metrics |
|---|
State GDP
Unemployment
Domestic Migration
State Government
State-Local Tax Burden
|
| Key Companies |
|---|
|
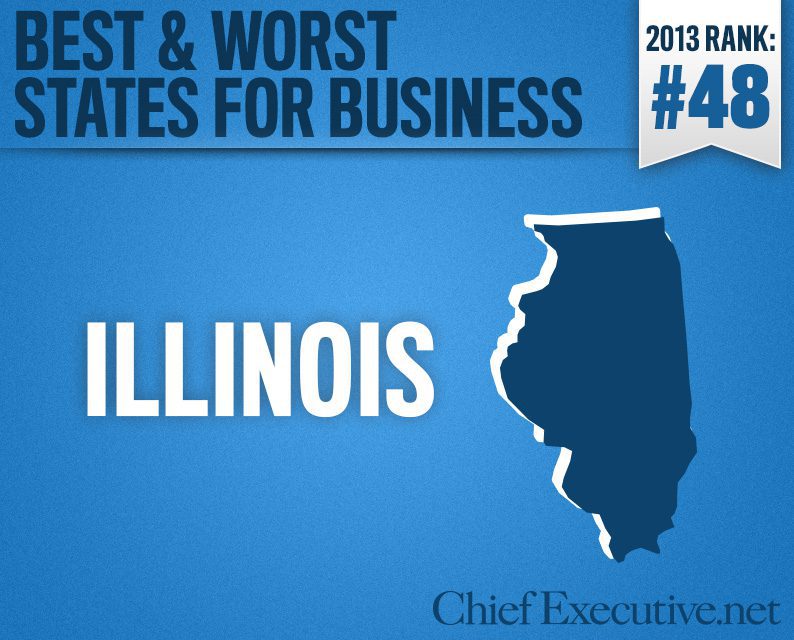
| Development Trend Indicator: Negative |
|---|
| Keeps adding to toxic environment with new effort to boost minimum wage. |
| CEO Comments |
|---|
| “Illinois — a complete and utter disaster when it comes to fiscal management. The inability to address key issues that are driving debt and instead increase the tax burden on businesses AND residents is mind-boggling. This is precisely why I intend to move my company to FL or TN.” |
Sources:
Bureau of Economic Analysis
Bureau of Labor Statistics
NewGeography.com
The Tax Foundation
Based on CEO Survey by ChiefExecutive.net
| Key Metrics |
|---|
State GDP
Unemployment
Domestic Migration
State Government
State-Local Tax Burden
|
| Key Companies |
|---|
|
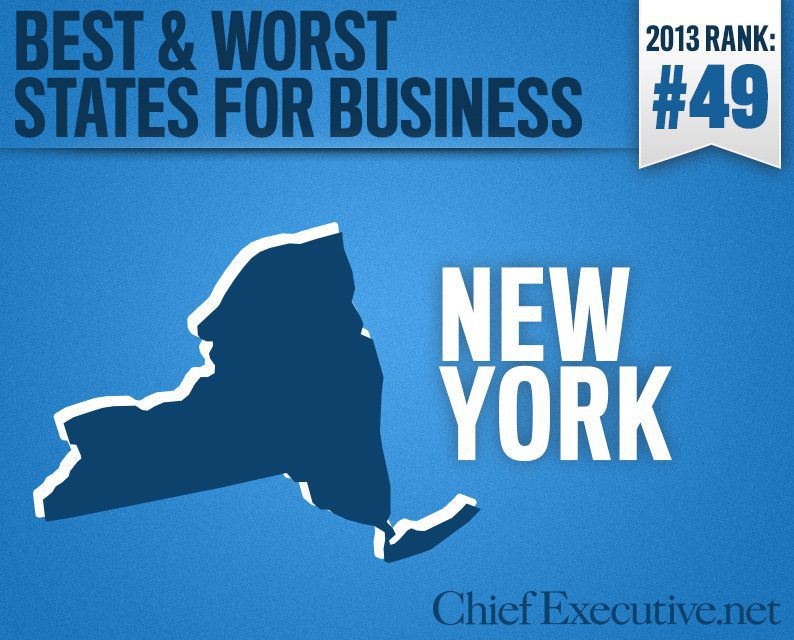
| Development Trend Indicator: Neutral |
|---|
| Gov. Cuomo seems to be less concerned now about business-friendliness. |
| CEO Comments |
|---|
| “New York’s taxes on the job creators is broken and taxing authorities are too bureaucratic–a glimpse of everything bad in the federal government; California is perpetually bankrupt and relies on market rallies to fix their budget. Their best and brightest are moving to the sunbelt with low tax burdens and pro-business governments. Only thing these states have going for them is the immigrant influx and the established industries already there.”
“90% of our business is in New York State, so I don’t have any good feedback on other states.” |
Sources:
Bureau of Economic Analysis
Bureau of Labor Statistics
NewGeography.com
The Tax Foundation
Based on CEO Survey by ChiefExecutive.net
| Key Metrics |
|---|
State GDP
Unemployment
Domestic Migration
State Government
State-Local Tax Burden
|
| Key Companies |
|---|
|
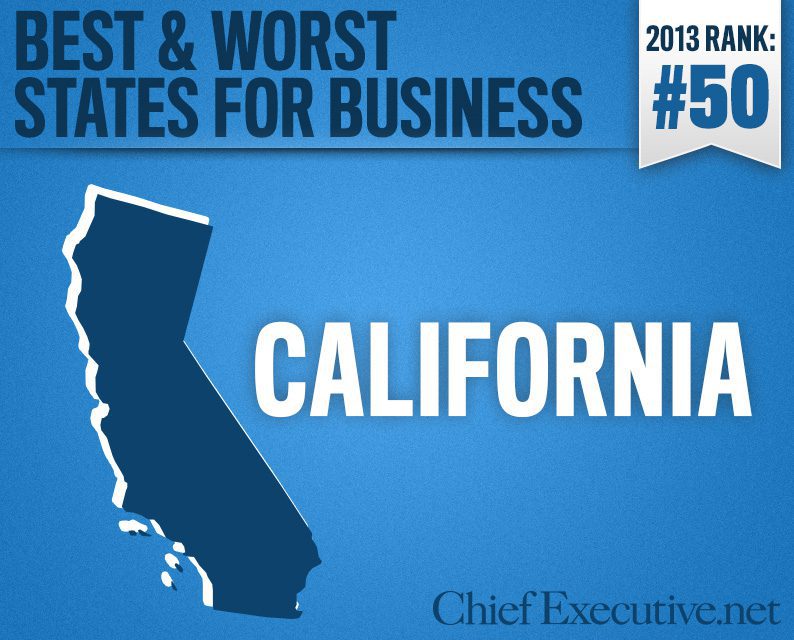
| Development Trend Indicator: Negative |
|---|
| Major income-tax hike in November hastens self-imposed economic decline. |
| CEO Comments |
|---|
| “Thank you, California! Keep applying pressure on your job creators and we will keep welcoming their move to Texas.”
“You cannot sustain economic strength with power only generated by wind farms and people working in fast food restaurants. Unless we all want to retreat to life in caves, you need power you can count on when the wind doesn’t blow and employment in businesses that produce both products of true value and wealth for their workforce.” |
2013 Best & Worst States for Business – Homepage
States More Aggressive in Competing With One Another
California Dreaming
Playing the Incentives Game
8 State Advocate CEOs
How CEOs Grade the States
Click here to see a slideshow of the 10 Best States for Business in 2013
Click here to see a slideshow of the 10 Worst States for Business in 2013
Sources:
Bureau of Economic Analysis
Bureau of Labor Statistics
NewGeography.com
The Tax Foundation
If your feed isn’t carrying your real thinking, it’s not just noise—it’s costing you credibility…
Dominique Bastien, founder of The Gondola Shop, shares how she stumbled into—and created—a niche industry…
A tech entrepreneur who built and sold two companies argues that the secret to great…
With more chief executives considering mergers and acquisitions, here are some questions for boards to…
To protect your immune system as you age, take steps to protect your overall health.…
The leaders who win consistently are those who sweat details, design for loyalty and experience…