Click here for the full rankings:
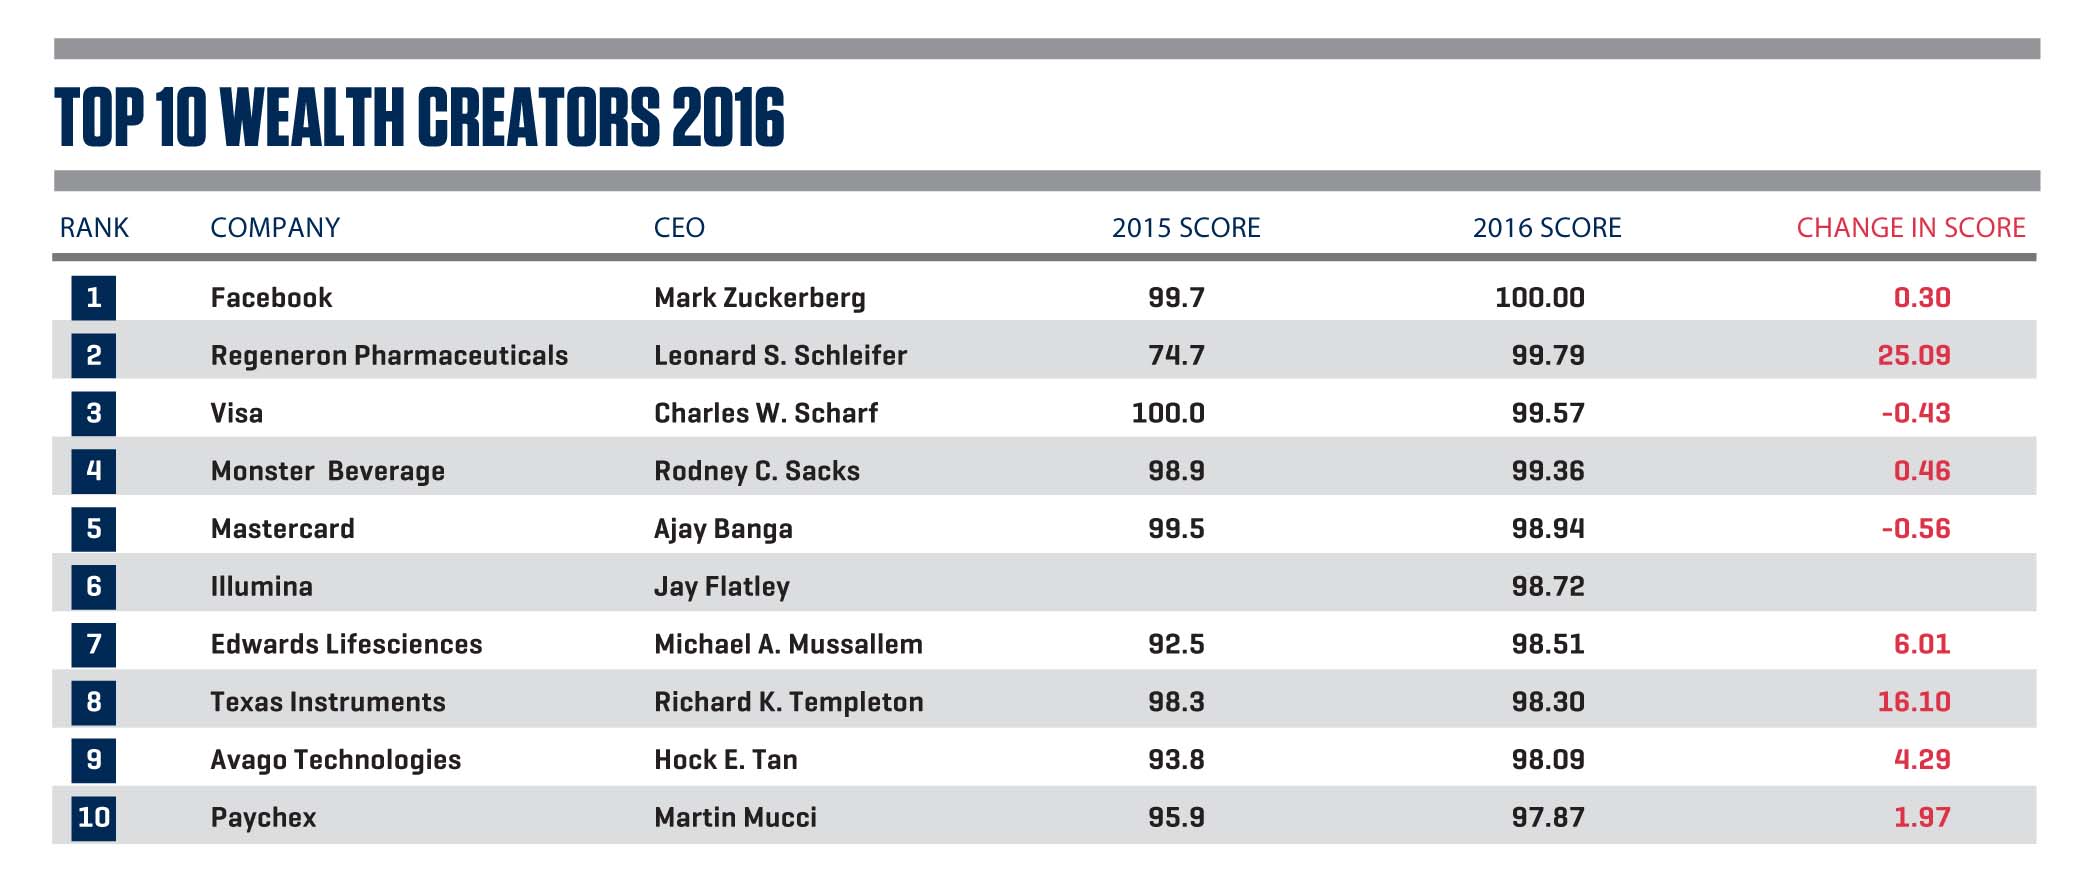
2016 S&P 500 WEALTH CREATORS INDEX
2016 MID-MARKET WEALTH CREATORS INDEX
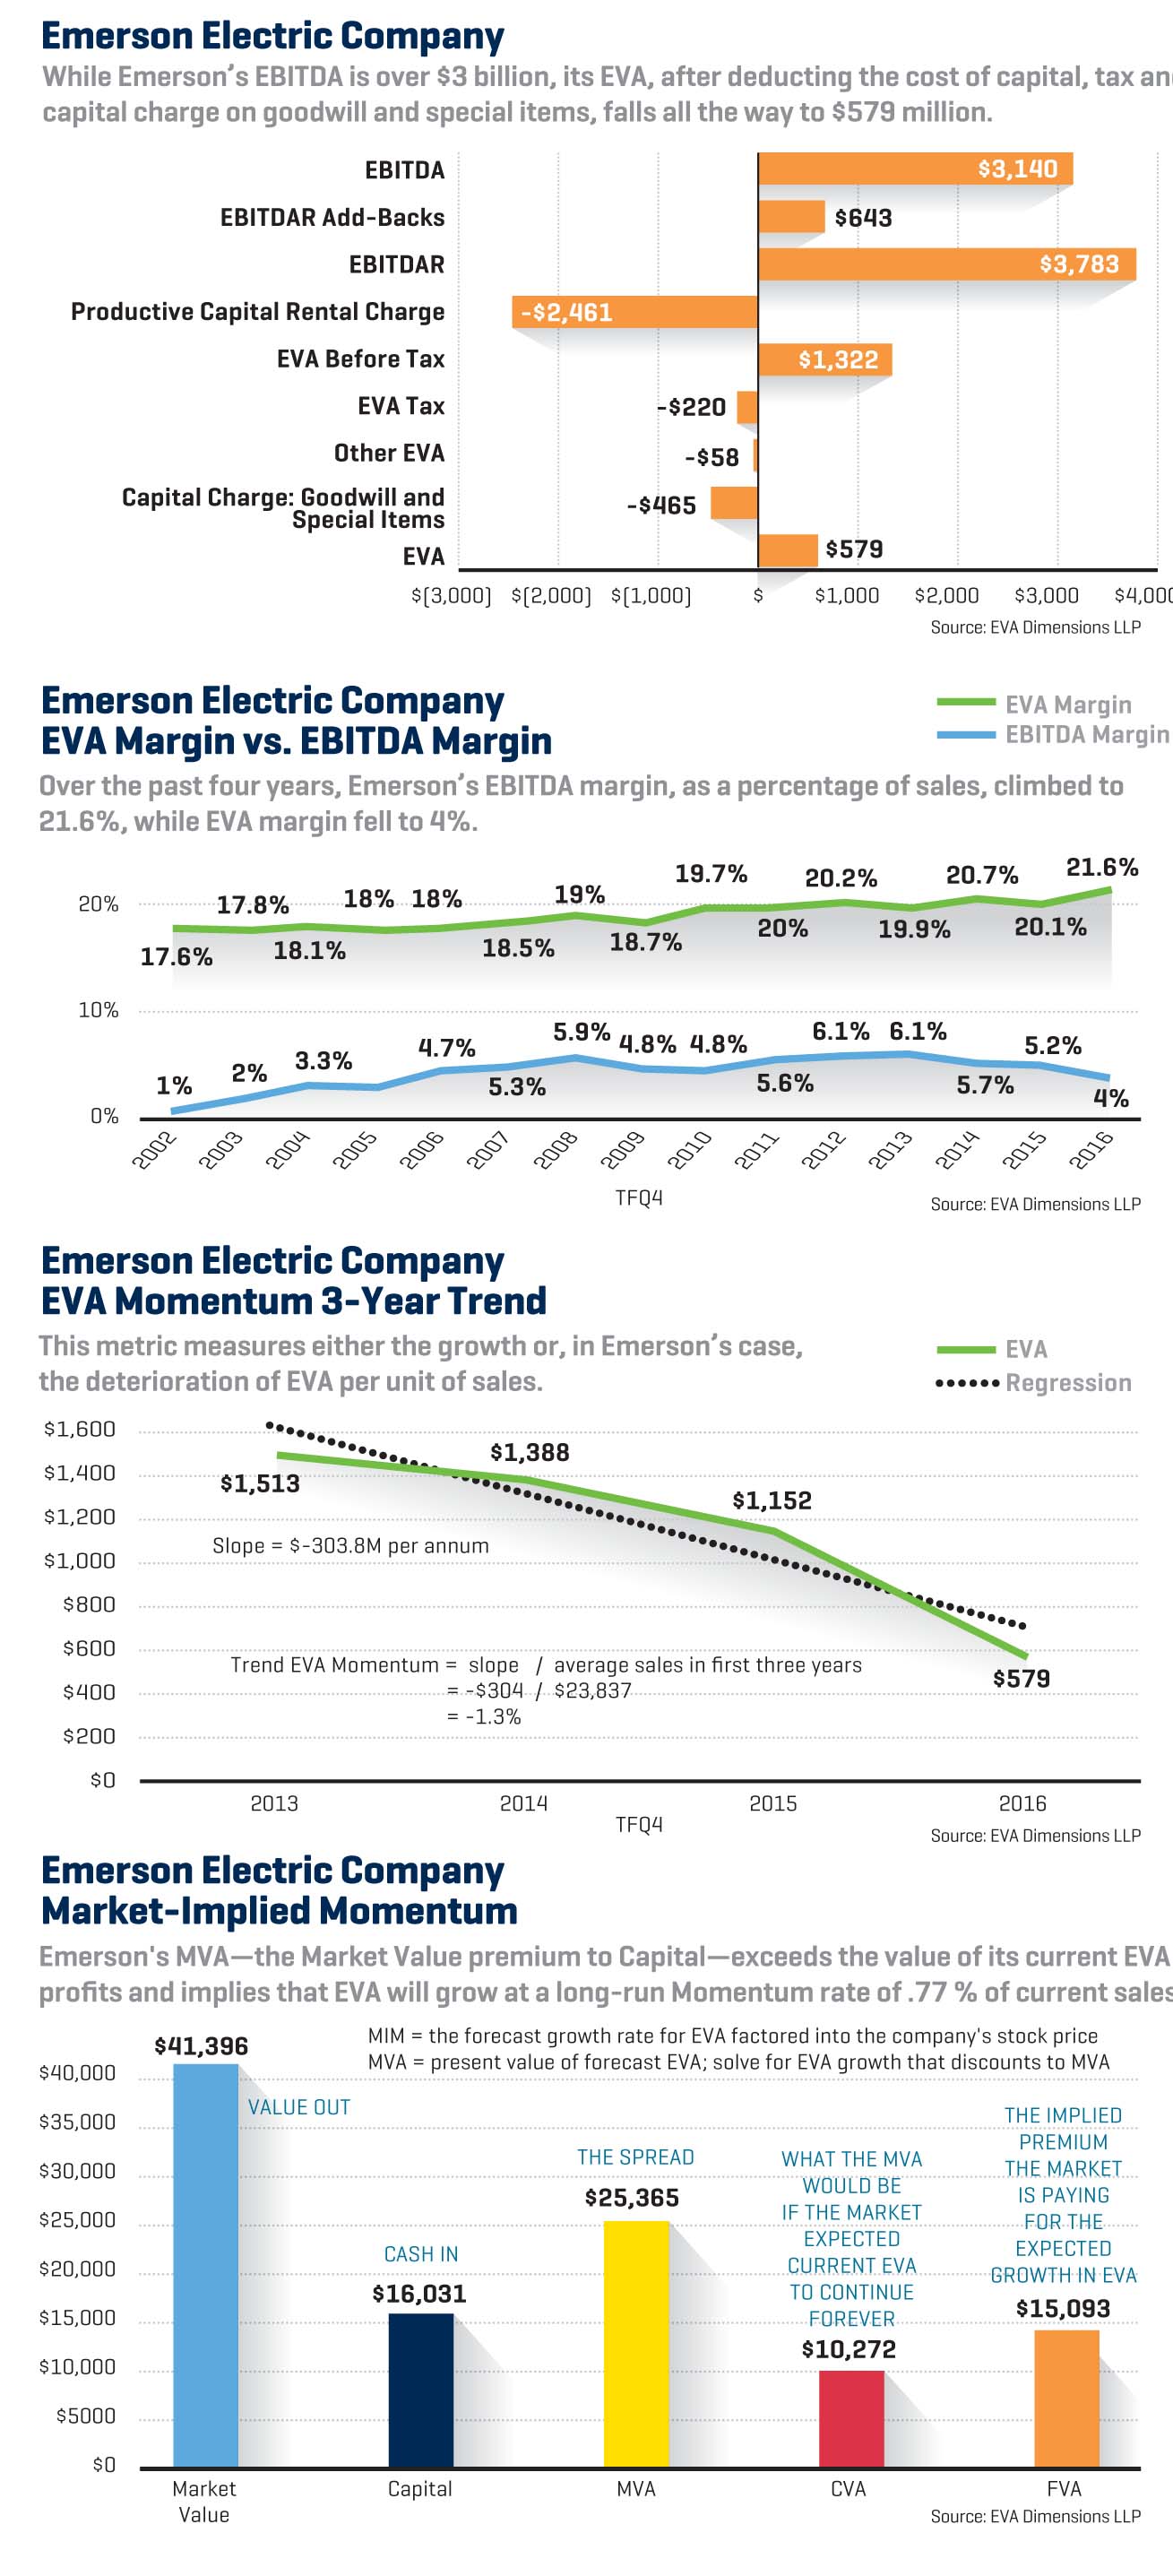
One way to gauge a company’s net value creation is by using EVA, or Economic Value Added. EVA, essentially, is profit remaining after subtracting the full cost of the capital the business uses, including a minimum shareholder return to compensate for risk.
For this year’s rankings, the ninth annual, we chose to offer a deeper dive into the metrics used to calculate WCI scores and illustrations of why and how they work. The full list of top wealth creators can be found at ChiefExecutive.net.
1) EVA Momentum, which shows the trend in the growth of the firm’s EVA over the past three years;
2) EVA Margin, which calculates how profitable the firm is per dollar of sales, blending pricing power, operating efficiency and how well assets are managed into a single net-margin score;
3) Market-Implied EVA Momentum, which measures the expected future growth rate for economic profit as reflected in the company’s stock price; and
4) MVA Margin, which calculates Market Value Added, or MVA, as a percentage of sales. MVA is the difference between a firm’s stock-market value and the overall amount of capital it has invested, or the shareholder wealth created.
A look at one company’s success
How to Increase your WCI Score
Ranking CEO Wealth Creation: The Methodology
To protect your immune system as you age, take steps to protect your overall health.…
The leaders who win consistently are those who sweat details, design for loyalty and experience…
More than a third of large organizations are undergoing business transformations at any given time,…
In the first 90 days, the right conversations matter more than most new managers realize—and…
A committee of his peer CEOs recognized Brown for transforming a once-struggling cellular handset manufacturer…
The bestselling author and advisor to CEOs shares what he’s counseling manufacturers as they navigate…