
In my recent column, “How to Manage Your Variance Profit Cycle,” I explained how to systematically answer two of the most important, but vexing, questions that CFOs, CEOs and boards of directors face every month:
• Why did we miss our budget? and,
• What can we do about it?
We’ve had an overwhelmingly positive response from both top executives and major institutional investors. However, they quickly asked the all-important follow-up question:
• How do we know if we have the right budget?
Your Profit Health Index (PHI) gives you the answer to this vital question.
Beyond the Hamburger Budget
For years, companies had a “hamburger budget.” In essence, they viewed their companies as a hamburger: Customers were the top of the bun, Operations was the meat in the middle, and Suppliers were the bottom of the bun. The underlying objectives of the budget were to increase customer revenues, reduce operations costs and force down supplier charges. The company’s budget, operating reviews, key performance indicators (KPIs) and compensation systems all were firmly rooted in this seemingly obvious set of company objectives.
Thirty years ago, this was a sound set of objectives. Today, this is the biggest error a manager can make. This reflects an enormous set of changes that business have gone through over the past 20 years.
The Age of Diverse Markets
In the prior Age of Mass Markets, which occurred throughout most of the 20th century, revenue maximization was the prime objective. Companies had relatively homogeneous pricing, cost to serve was relatively uniform as the products were just dropped at the customers’ receiving docks, and economies of scale (unit costs dropped as unit sales volumes increased) drove huge profits.
Throughout this bygone era, management’s primary goal was to maximize revenue while minimizing cost. The hamburger budgets were aligned with this objective.
Over the past 20 years, however, our business system has changed enormously. We have entered what I call the Age of Diverse Markets. In this new era, companies have deployed pricing that often varies from customer to customer, and even product to product within customers. Cost to serve varies again by customer, and even by product within a customer.
An Enterprise Profit Management solution (EPM)—a SaaS system which creates a full, all-in P&L on literally every transaction (every invoice line, based on precise information pulled directly from a company’s general ledger)—can be configured in a few weeks and provides the financial information that managers now need. Over years of experience with EPM, we have found that virtually all companies have a characteristic pattern of profit segmentation:
• Profit Peak customers—typically about 15 percent of the customers generate 150 percent of a company’s profits;
• Profit Drain customers—typically about 20 percent of the customers erode about 50 percent of these profits; and
• Profit Desert customers—typically the remainder of the customers produce minimal profit but consume about 50 percent of a company’s resources.
The same profit pattern characterizes every dimension of a company—products, suppliers, sales reps and order lines.
Because EPM shows the all-in P&L details of literally every customer and product, you can clearly see where your company is making money, where it is losing money, and why—the information essential for success in today’s complex, rapidly changing business world.
EPM enables you to accomplish today’s new business imperatives:
• Grow your Profit Peaks. This is your most important priority; it gives you a direct, rapid profit increase and, importantly, ensures that your critical highest-profit business segment does not erode.
• Reverse your Profit Drains. In most cases these large, money-losing customers are unprofitable not because they have under-market pricing, but rather because they have excessive operating costs most often due to unmeasured, unmanaged costs like overly frequent ordering and excessive expediting (which are costly for both your customer and for you), and low-net-margin product mixes.
• Reduce your Profit Desert Cost to Serve. A few of your profit desert customers are important development accounts that warrant extra time and cost, but most are small, marginal customers with low profit potential. The key objective is to reduce your cost to serve through measures like portals, standardized menus and strict management of “extras.”
Profit Segment Management
Consider the company depicted in Exhibit 1. In this highly profitable company, 18 percent of the customers are Profit Peaks. Together, they account for 48 percent of the revenues and produce 133 percent of the company’s net profits. The Profit Drain customers, on the other hand, comprise 28 percent of the customers and produce 32 percent of the revenues, while eroding 47 percent of the net profits. About 54 percent of the customers are Profit Deserts, accounting for 20 percent of the revenues and a mere 8 percent of the profits. Please bear in mind that this is a very characteristic profit segmentation for a very successful company.
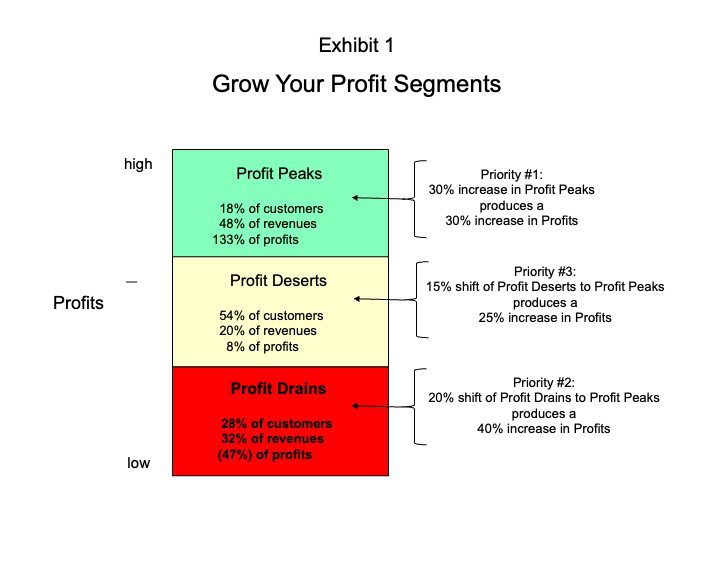
The first priority is to focus on increasing the Profit Peaks. For example, increasing the Profit Peak revenues, either by obtaining new Profit Peak accounts or, even better, by further increasing penetration of your current Profit Peak accounts by 30 percent produces a 30 percent increase in net profits.
Yet, in most companies, the dominant sales metric is aggregate revenue increase (regardless of whether from growing Profit Peaks or Profit Drains); while the dominant supply chain metric is aggregate cost reduction (even if the increased supply chain costs stem from high-payoff investments in customer service for fast-growing, service-sensitive Profit Peak customers).
The second priority—contrary to most managers’ instincts to simply drop these accounts—is to convert Profit Drain customers into Profit Peaks by reducing unnecessary operating costs (e.g., ordering too often), which will produce a win-win for both you and your customers. In our experience, perhaps half of most companies’ Profit Drain customers could be converted to Profit Peaks, while the other half of this profit segment are simply bargain hunters and should be charged “full freight.”
A 20 percent shift in Profit Drain customers to Profit Peaks produces a 40 percent increase in profits.
The third priority is to grow the relatively few Profit Desert customers that have high untapped potential to become Profit Peaks, while using automated measures (and similar tactics) to reduce their cost to serve. A 15 percent shift in Profit Desert customers to Profit Peaks produces a 25 percent increase in net profits. However, beware. The digital giants, like Amazon, are aiming directly at this segment, using extremely effective arm’s length tactics like information-rich websites.
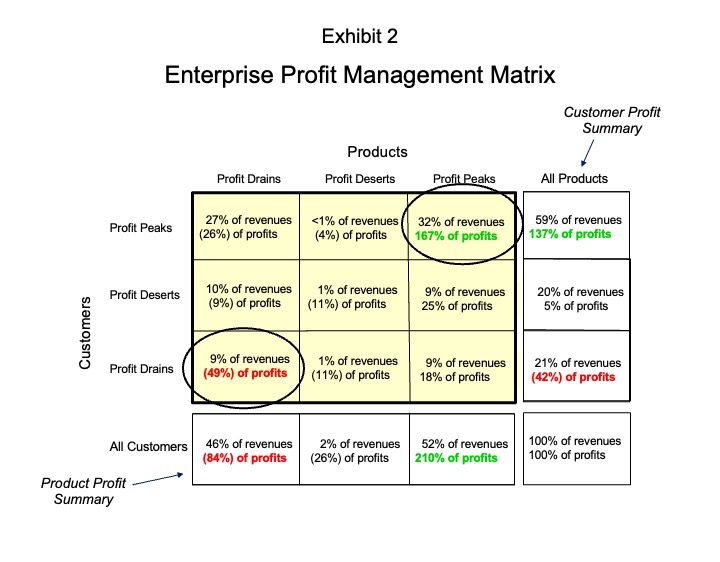
Exhibit 2, an Enterprise Profit Management matrix, shows the intersection of customer profit segments (on the vertical axis) and product profit segments (on the horizontal axis). It shows the extreme concentration of profits and losses in the customer/product profit segment mix in even highly profitable companies. Here, the upper right node—Profit Peak products bought by Profit Peak customers—accounts for 32 percent of the company’s revenues and a whopping 167 percent of the company’s profits, while the lower left node—Profit Drain products bought by Profit Drain customers—accounts for a mere 9 percent of the revenues while eroding an amazing 49 percent of the profits.
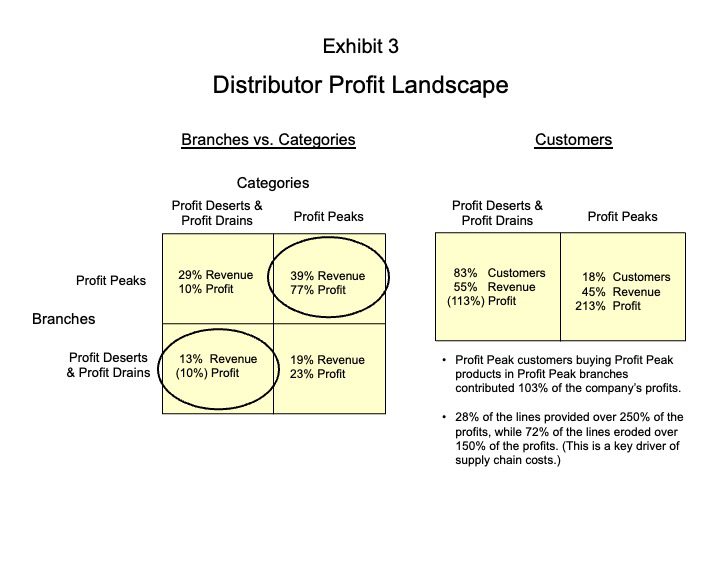
Exhibit 3 presents a profit landscape for a highly profitable distributor. The matrix on the left side—Branches vs. Categories—shows this company’s profit segmentation (distributors typically budget and manage using these categories). The upper right node shows that Profit Peak categories sold in Profit Peak branches provided 30 percent of the revenue and fully 77 percent of the profits, while the lower left node—Profit Desert & Profit Drain categories sold in Profit Desert & Profit Drain branches—provided 13 percent of the revenue, while eroding 10 percent of the profit.
The right side of Exhibit 3 displays the characteristics of the customer profit segments of the same highly successful company. This two-node matrix shows that the Profit Peak customers represent 18 percent of the company’s accounts, provide 45 percent of the revenues, and contribute an amazing 213 percent of the net profits. The Profit Desert and Profit Drain customers, on the other hand, combine to comprise fully 83 percent of the customers and 55 percent of the revenue, but drain an astonishing 113 percent of the profit.
The upper bullet below the two-node matrix notes that the company’s Profit Peak customers buying Profit Peak products in Profit Peak branches contributed fully 103 percent of the profits. Below that, the lower bullet shows that 28 percent of the order lines provided a surprising 250 percent of the profits, while 72 percent of the order lines eroded an astounding 150 percent of the profits.
Profit Health Index
The bottom-line conclusion is that the profitability differences between and among a company’s profit segments (Profit Peaks, Profit Drains and Profit Deserts) are enormous. This is why the obsolete, traditional “hamburger model” of company budgets and management objectives—more aggregate revenues, less aggregate costs, and lower aggregate supplier charges—is simply incorrect, inappropriate and completely counterproductive in today’s Age of Diverse Markets.
Instead, the right budget model is: Grow your Profit Peaks, Convert your Profit Drains to Profit Peaks and Reduce your cost to serve your Profit Deserts.
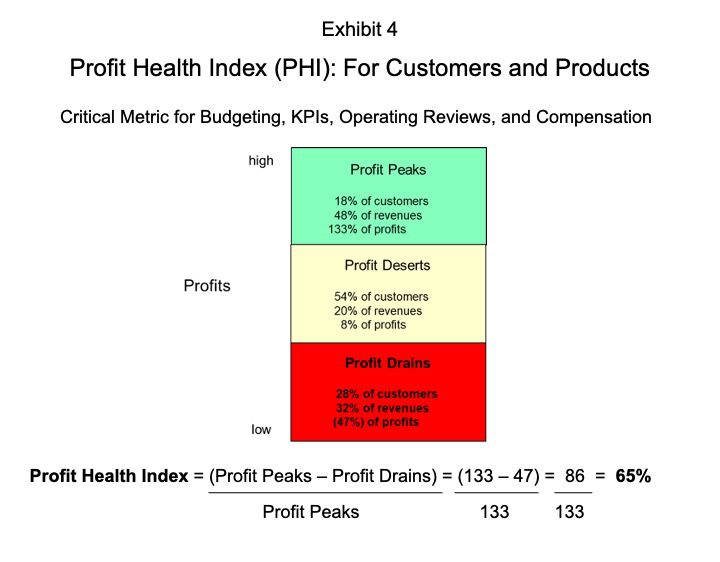
The action question today is: What simple, straightforward—but powerful—metric provides the information managers need to replace the “hamburger model” and turbocharge their companies’ profitable growth? The answer is the Profit Health Index. This is summarized in Exhibit 4.
The Profit Health Index is a straightforward comparison of a company’s Profit Peaks and Profit Drains. It is calculated as: the Net Profit Peaks (i.e., Profit Peaks minus the Profit Drains) divided by the Profit Peaks, expressed as a percentage. In essence, it is the percent of the Profit Peak profits that “read through” to the company’s net profit bottom line.
For example, here is the Profit Health Index for the company in Exhibit 1:
Profit Health Index = (Profit Peaks – Profit Drains) ÷ Profit Peaks = (133 – 47) ÷ 133 = 86/133 = 65 percent.
In this company, 65 percent of the Profit Peak profits “read through” to the company’s bottom line.
The Profit Health Index can be calculated for any dimension or aspect of a company: overall customers, customers in a market segment (e.g., geographic, psychographic), products, stores/branches, responses to advertising or promotions and so on). It evaluates the profit health of a company’s budget and actuals in a period, and should be used as the main management metric for budgeting, along with performance measurement and evaluation systems, including operating reviews and compensation.
Very Important Broad Value
This crucial metric also has very important broad value outside the company. For example, in a merger, the selling company is almost always reluctant to reveal the profitability of its specific customers and products to the acquiring company (for fear of later competition in its Profit Peaks if the merger fails). This leads to extremely difficult problems in estimating the “quality of earnings” of the merger target. The Profit Health Index solves this problem by showing the robustness or fragility of earnings, especially when trended over several periods—all without giving away the identity of the specific customers and products in each profit segment.
Similarly, it is extremely valuable for potential investors, as it gives an extremely accurate CT scan of a company’s internal profit segment structure without giving away the company’s specific “secrets” like particularly profitable or problematic customers and products. The current best-practice investment performance projection metric, EBITDA margin, is far less helpful than the Profit Health Index because the former measure focuses on a company’s aggregate performance, while the latter shows the details of how and why it occurred—details that are necessary in order to assess and project the extent to which a potential investment target will continue to achieve high levels of profitable growth.
In fact, in a recent meeting with dozens of major institutional investors, there was an overwhelming interest in using the Profit Health Index—especially when trends were observed over several periods—both to evaluate current investments and to gauge potential investments.
Essential Appropriateness and Critical Importance
This broad value footprint underscores the essential appropriateness and critical importance of the Profit Health Index both to drive internal profitable growth, and to successfully frame and manage extremely important external initiatives like mergers and acquisitions as well as investor relations. Together, they will ensure that your company reliably achieves years of high profit growth.